Concept explainers
Videos
The bar graphs show U. S. film box-office receipts, in millions of dollars, and box-office admissions, in millions of tickets sold, for five selected years.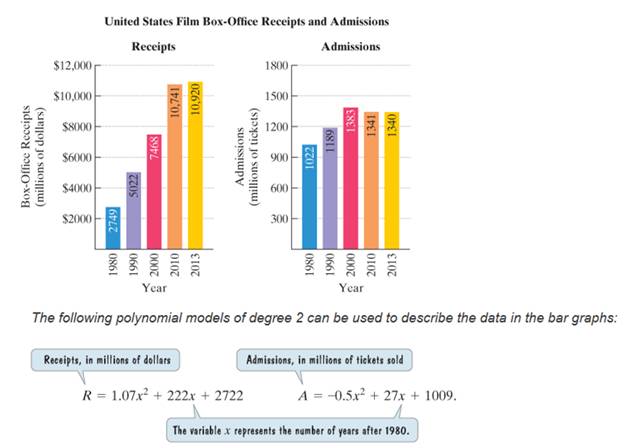
Use the information and a calculator to solve exercises 87-88.
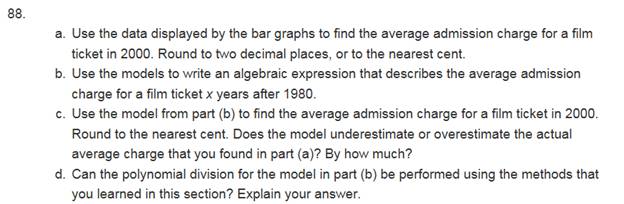
88.
a. Use the data displayed by the bar graphs to find the average admission charge for a film ticket in 2000. Round to two decimal places, or to the nearest cent.
b. Use the models to write an algebraic expression that describes the average admission charge for a film ticket x years after 1980.
c. Use the model from part (b) to find the average admission charge for a film ticket in 2000. Round to the nearest cent. Does the model underestimate or overestimate the actual average charge that you found in part (a)? By how much?
d. Can the polynomial division for the model in part (b) be performed using the methods that you learned in this section? Explain your answer.
Want to see the full answer?
Check out a sample textbook solution
Chapter 5 Solutions
MyLab Math with Pearson eText -- 24 Month Standalone Access Card -- for Introductory Algebra for College Students with Integrated Review


- If you travel 100 miles in two hours, then your average speed for the trip is Average speed=_________=________arrow_forwardHeart Disease In a certain country, the number of deaths due to heart disease decreased from 235 in one year to 221 in the next year. What percentage decrease in deaths due to heart disease does this represent?arrow_forwardGraph on the number line: (a) x2 (b) x3 (c) x1arrow_forward
- A realtor studies the relationship between the size of a house (in square feet) and the property taxes (in $) owed by the owner. The table below shows a portion of the data for 20 homes in a suburb 60 miles outside of New York City. [You may find it useful to reference the t table.] Property Taxes Size 21,872 2,464 17,498 2,451 ⋮ ⋮ 29,294 2,895 Click here for the Excel Data File a-1. Calculate the sample correlation coefficient rxy. (Round intermediate calculations to at least 4 decimal places and final answers to 4 decimal places.) a-2. Interpret rxy. multiple choice 1 The correlation coefficient indicates a positive linear relationship. The correlation coefficient indicates a negative linear relationship. The correlation coefficient indicates no linear relationship. b. Specify the competing hypotheses in order to determine whether the population correlation coefficient between the size of a…arrow_forwardThe bar graph shows elavations (in feet) of several lakes in North America.(Note: The Salton Sea is actually a lake located in California.) Michelle claims that Lake Pontchartrain and Lake Okeechobee are the two lakes closest to sea level. Explain why Michelle’s reasoning is incorrect? Provide the correct answer. Use appropriate mathematical language to justify your response.arrow_forwardThe bar graph shows the average cost of tuition and fees at private four-year colleges in a particular country. Below are two mathematical models for the data shown in the graph. In each formula, T represents the average cost of tuition and fees at private colleges for the school year ending x years after 2000. Answer parts a and b. Average Cost of Tuition and Fees at Private Four-Year Colleges 22 20- 22,051 21,057 20,095 19,128 18,135 18- 16.203 16 15 218 17,168 Model 1 T= 974x+ 15,223 Model 2 T= - 2.1x + 988x + 15,208 14 2000 2001 20022003 2004 2005 2006 2007 a. Use each model to find the average cost of tuition and fees at private colleges for the school vear ending in 2003. By how much does each model underestimate or overestimate the actual cost shown for the school year ending in 2003? HIHE The average cost given by model 1 is $ Round to the nearest dollar.) Help Me Solve This Textbook Get More Help - Clear All Skill Builder Check Answer 10.19 PM 65°F 9/6/2021 Type here to search…arrow_forward
- what’s the lightest? and what’s the heaviest?arrow_forwardFort Wayne Crime Rate per Year |100,000 people 2012 256.2 2013 266.2 2014 229.7 2015 288 2016 307.5 2017 283.5 Find the absolute change in Fort Wayne's crime rate per 100,000 people from 2015 to 2017. (round to the nearest tenth if needed)arrow_forwardPlease help me answer a,b and c with complete solutionarrow_forward
- In a month where the price of eggs is above average, would you expect the price of milk to be above average or below average? Explain.arrow_forwardDiscribe a specific time in real life where a population being surveyed is appropriate. What data are you trying to collect, and give reasons why surveying the population is appropriate. 1. Describe the situation 2. Support why surveying the population is appropriate, using details.arrow_forwardThe level of fame of an artist is assigned from 1 to 10, with 10 signifying the most famous artist. Data are collected about selling prices for painting and the level of fame of the artists. The model ŷ = 958.25(2.988)x is calculated, where x represents the artist's fame score and ŷ represents the predicted selling price of the painting. Use the model to predict the selling price of a painting whose artist's fame is a level 5. $143,163 $192,441 $228,235 $958,250arrow_forward
 Glencoe Algebra 1, Student Edition, 9780079039897...AlgebraISBN:9780079039897Author:CarterPublisher:McGraw Hill
 Functions and Change: A Modeling Approach to Coll...AlgebraISBN:9781337111348Author:Bruce Crauder, Benny Evans, Alan NoellPublisher:Cengage Learning
 Holt Mcdougal Larson Pre-algebra: Student Edition...AlgebraISBN:9780547587776Author:HOLT MCDOUGALPublisher:HOLT MCDOUGAL
 College Algebra (MindTap Course List)AlgebraISBN:9781305652231Author:R. David Gustafson, Jeff HughesPublisher:Cengage Learning
 Big Ideas Math A Bridge To Success Algebra 1: Stu...AlgebraISBN:9781680331141Author:HOUGHTON MIFFLIN HARCOURTPublisher:Houghton Mifflin Harcourt