
Videos
Online Advertising Revenue The data in the table below represent the U.S. online advertising revenues for the years 2005-2014.
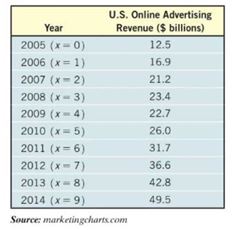
(a) Using a graphing utility, draw a
(b) Based on the scatter diagram drawn in part (a), decide what model (linear, quadratic, cubic, exponential, logarithmic, or logistic) that you think best describes the relation between year and revenue.
(c) Using a graphing utitlity, find the model of best fit.
(d) Using a graphing utility, draw the model of best fit on the scatter diagram drawn in part (a).
(e) Use your model to predict the online advertising revenue in 2016.
Want to see the full answer?
Check out a sample textbook solution
Chapter 5 Solutions
Precalculus Enhanced with Graphing Utilities Plus MyLab Math with Pearson eText - Access Card Package (7th Edition) (Sullivan & Sullivan Precalculus Titles)


- World Population The following table shows world population N, in billions, in the given year. Year 1950 1960 1970 1980 1990 2000 2010 N 2.56 3.04 3.71 4.45 5.29 6.09 6.85 a. Use regression to find a logistic model for world population. b. What r value do these data yield for humans on planet Earth? c. According to the logistic model using these data, what is the carrying capacity of planet Earth for humans? d. According to this model, when will world population reach 90 of carrying capacity? Round to the nearest year. Note: This represents a rather naive analysis of world population.arrow_forwardLong-Term Data and the Carrying Capacity This is a continuation of Exercise 13. Ideally, logistic data grow toward the carrying capacity but never go beyond this limiting value. The following table shows additional data on paramecium cells. t 12 13 14 15 16 17 18 19 20 N 610 513 593 557 560 522 565 517 500 a. Add these data to the graph in part b of Exercise 13. b. Comment on the relationship of the data to the carrying capacity. Paramecium Cells The following table is adapted from a paramecium culture experiment conducted by Cause in 1934. The data show the paramecium population N as a function of time t in days. T 2 3 5 6 8 9 10 11 N 14 34 94 189 330 416 507 580 a. Use regression to find a logistic model for this population. b. Make a graph of the model you found in part a. c. According to the model you made in part a, when would the population reach 450?arrow_forwardSales of a video game released in the year 2000 took off at first, but then steadily slowed as time moved on. Table 4 shows the number of games sold, in thousands, from the years 20002010. a. Let x represent time in years starting with x=1 for the year 2000. Let y represent the number of games sold in thousands. Use logarithmic regression to fit a model to these data. b. If games continue to sell at this rate, how many games will sell in 2015? Round to the nearest thousand.arrow_forward
 Functions and Change: A Modeling Approach to Coll...AlgebraISBN:9781337111348Author:Bruce Crauder, Benny Evans, Alan NoellPublisher:Cengage Learning
 College AlgebraAlgebraISBN:9781305115545Author:James Stewart, Lothar Redlin, Saleem WatsonPublisher:Cengage Learning
 Algebra and Trigonometry (MindTap Course List)AlgebraISBN:9781305071742Author:James Stewart, Lothar Redlin, Saleem WatsonPublisher:Cengage Learning
 Algebra & Trigonometry with Analytic GeometryAlgebraISBN:9781133382119Author:SwokowskiPublisher:Cengage