Concept explainers
Videos
Population Model The following data represent the population of the United States. An ecologist is interested in building a model that describes the population of the United States.
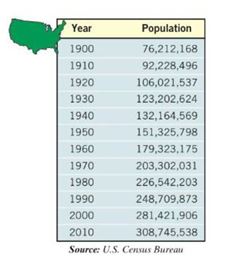
(a) Using a graphing utility, draw a
(b) Using a graphing utility, build a logistic model from the data.
(c) Using a graphing utility, draw the function found in part (b) on the scatter diagram.
(d) Based on the function found in part (b), what is the carrying capacity of the United States?
(e) Use the function found in part (b) to predict the population of the United States in 2012.
(f) When will the United States population be ?
(g) Compare actual U.S. Census figures to the predictions found in parts (e) and (f). Discuss any differences.
Want to see the full answer?
Check out a sample textbook solution
Chapter 5 Solutions
Precalculus Enhanced with Graphing Utilities Plus MyLab Math with Pearson eText - Access Card Package (7th Edition) (Sullivan & Sullivan Precalculus Titles)


- Logistic Population growth the table and scatter plot give the population of black flies in a closed laboratory container over an 18 day period. (a) Use the logistic command on your calculator to find a logistic model for these data. (b) Use the model to estimate the time when there were 400 flies in the containerarrow_forwardLong-Term Data and the Carrying Capacity This is a continuation of Exercise 13. Ideally, logistic data grow toward the carrying capacity but never go beyond this limiting value. The following table shows additional data on paramecium cells. t 12 13 14 15 16 17 18 19 20 N 610 513 593 557 560 522 565 517 500 a. Add these data to the graph in part b of Exercise 13. b. Comment on the relationship of the data to the carrying capacity. Paramecium Cells The following table is adapted from a paramecium culture experiment conducted by Cause in 1934. The data show the paramecium population N as a function of time t in days. T 2 3 5 6 8 9 10 11 N 14 34 94 189 330 416 507 580 a. Use regression to find a logistic model for this population. b. Make a graph of the model you found in part a. c. According to the model you made in part a, when would the population reach 450?arrow_forwardWorld Population The following table shows world population N, in billions, in the given year. Year 1950 1960 1970 1980 1990 2000 2010 N 2.56 3.04 3.71 4.45 5.29 6.09 6.85 a. Use regression to find a logistic model for world population. b. What r value do these data yield for humans on planet Earth? c. According to the logistic model using these data, what is the carrying capacity of planet Earth for humans? d. According to this model, when will world population reach 90 of carrying capacity? Round to the nearest year. Note: This represents a rather naive analysis of world population.arrow_forward
- Sales of a video game released in the year 2000 took off at first, but then steadily slowed as time moved on. Table 4 shows the number of games sold, in thousands, from the years 20002010. a. Let x represent time in years starting with x=1 for the year 2000. Let y represent the number of games sold in thousands. Use logarithmic regression to fit a model to these data. b. If games continue to sell at this rate, how many games will sell in 2015? Round to the nearest thousand.arrow_forwardWhat situations are best modeled by a logistic equation? Give an example, and state a case for why the example is a good fit.arrow_forwardModeling Human Height with a Logistic Function A male child is 21inches long at birth and grows to an adult height of 73inches. In this exercise, we make a logistic model of his height as a function of age. a. Use the given information to find K and b for the logistic model. b. Suppose he reaches 95 of his adult height at age 16. Use this information and that from part a to find r. Suggestion: You will need to use either the crossing-graphs method or some algebra involving the logarithm. c. Make a logistic model for his height H, in inches, as a function of his age t, in years. d. According to the logistic model, at what age is he growing the fastest? e. Is your answer to part d consistent with your knowledge of how humans grow?arrow_forward
 College AlgebraAlgebraISBN:9781305115545Author:James Stewart, Lothar Redlin, Saleem WatsonPublisher:Cengage Learning
 Functions and Change: A Modeling Approach to Coll...AlgebraISBN:9781337111348Author:Bruce Crauder, Benny Evans, Alan NoellPublisher:Cengage Learning
 Algebra & Trigonometry with Analytic GeometryAlgebraISBN:9781133382119Author:SwokowskiPublisher:Cengage
 Algebra and Trigonometry (MindTap Course List)AlgebraISBN:9781305071742Author:James Stewart, Lothar Redlin, Saleem WatsonPublisher:Cengage Learning
 College Algebra (MindTap Course List)AlgebraISBN:9781305652231Author:R. David Gustafson, Jeff HughesPublisher:Cengage Learning