Concept explainers
Videos
Age versus Total Cholesterol The following data represent the age and average total cholesterol for adult males at various ages.
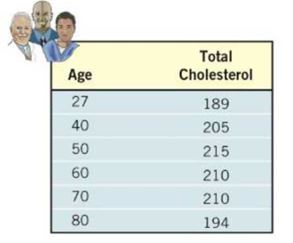
(a) Using a graphing utility, draw a
(b) Based on the scatter diagram drawn in part (a), decide on a model (linear, quadratic, cubic, exponential, logarithmic, or logistic) that you think best describes the relation between age and total cholesterol. Be sure to justify your choice of model.
(c) Using a graphing utility, find the model of best fit.
(d) Using a graphing utility, draw the model of best fit on the scatter diagram drawn in part (a).
(e) Use your model to predict the total cholesterol of a 35-year-old male.
Want to see the full answer?
Check out a sample textbook solution
Chapter 5 Solutions
Precalculus Enhanced with Graphing Utilities (7th Edition)


- Sales of a video game released in the year 2000 took off at first, but then steadily slowed as time moved on. Table 4 shows the number of games sold, in thousands, from the years 20002010. a. Let x represent time in years starting with x=1 for the year 2000. Let y represent the number of games sold in thousands. Use logarithmic regression to fit a model to these data. b. If games continue to sell at this rate, how many games will sell in 2015? Round to the nearest thousand.arrow_forwardTable 2 shows a recent graduate’s credit card balance each month after graduation. a. Use exponential regression to fit a model to these data. b. If spending continues at this rate, what will the graduate’s credit card debt be one year after graduating?arrow_forwardThe fox population in a certain region has an annualgrowth rate of 9 per year. In the year 2012, therewere 23,900 fox counted in the area. What is the foxpopulation predicted to be in the year 2020 ?arrow_forward

 Algebra & Trigonometry with Analytic GeometryAlgebraISBN:9781133382119Author:SwokowskiPublisher:Cengage
 College AlgebraAlgebraISBN:9781305115545Author:James Stewart, Lothar Redlin, Saleem WatsonPublisher:Cengage Learning