Concept explainers
Videos
Ethanol Production The data in the table below represent ethanol production (in billions of gallons) in the United States from 2000 to 2014.
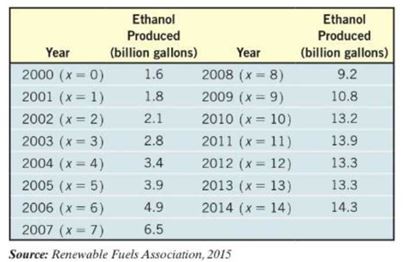
(a) Using a graphing utility, draw a
(b) Using a graphing utility, build an exponential model from the data.
(c) Express the function found in part (b) in the form .
(d) Graph the exponential function found in part (b) or (c) on the scatter diagram.
(e) Use the model to predict the amount of ethanol that will be produced in 2016.
(f) Interpret the meaning of in the function found in part (c).

Trending nowThis is a popular solution!

Chapter 5 Solutions
Precalculus Enhanced with Graphing Utilities, Books A La Carte Edition (7th Edition)


- The half-life of plutonium-244 is 80,000,000 years. Find function gives the amount of carbon-14 remaining as a function of time, measured in years.arrow_forwardEnter the data from Table 2 into a graphing calculator and graph the ranking scatter plot. Determine whetherthe data from the table would likely represent a function that is linear, exponential, or logarithmic.arrow_forwardDoes a linear, exponential, or logarithmic model best fit the data in Table 2? Find the model.arrow_forward

 Glencoe Algebra 1, Student Edition, 9780079039897...AlgebraISBN:9780079039897Author:CarterPublisher:McGraw Hill
 Algebra & Trigonometry with Analytic GeometryAlgebraISBN:9781133382119Author:SwokowskiPublisher:Cengage