
Concept explainers
Videos
Age versus Total Cholesterol The following data represent the age and average total cholesterol for adult males at various ages.
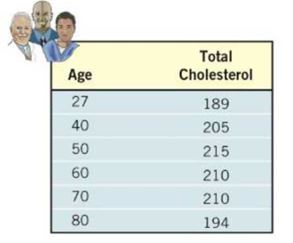
(a) Using a graphing utility, draw a
(b) Based on the scatter diagram drawn in part (a), decide on a model (linear, quadratic, cubic, exponential, logarithmic, or logistic) that you think best describes the relation between age and total cholesterol. Be sure to justify your choice of model.
(c) Using a graphing utility, find the model of best fit.
(d) Using a graphing utility, draw the model of best fit on the scatter diagram drawn in part (a).
(e) Use your model to predict the total cholesterol of a 35-year-old male.
Want to see the full answer?
Check out a sample textbook solution
Chapter 5 Solutions
Precalculus Enhanced with Graphing Utilities, Books A La Carte Edition (7th Edition)


- Respiratory Rate Researchers have found that the 95 th percentile the value at which 95% of the data are at or below for respiratory rates in breath per minute during the first 3 years of infancy are given by y=101.82411-0.0125995x+0.00013401x2 for awake infants and y=101.72858-0.0139928x+0.00017646x2 for sleeping infants, where x is the age in months. Source: Pediatrics. a. What is the domain for each function? b. For each respiratory rate, is the rate decreasing or increasing over the first 3 years of life? Hint: Is the graph of the quadratic in the exponent opening upward or downward? Where is the vertex? c. Verify your answer to part b using a graphing calculator. d. For a 1- year-old infant in the 95 th percentile, how much higher is the walking respiratory rate then the sleeping respiratory rate? e. f.arrow_forwardDoes Table 1 represent a linear function? If so, finda linear equation that models the data.arrow_forwardA sales manager wants to examine the relationship between the number of daily customers (x) and the revenue generated (y). For this purpose, he made observations in a randomly chosen 6 days for a store and observed the number of daily customers and the revenue (1000 TL). The personally created data set for the x and y variables is included in the attached “Homework data” file. Using the data set defined on your behalf; x1 x2 x3 x4 x5 x6 y1 y2 y3 y4 y5 y6 sb1 Burak data 74 86 96 105 110 124 290 307 331 406 421 481 0.491 a) Create the regression equation b) Interpret b0 and b1 values c) Test and interpret whether there is a linear relationship between the number of daily customers and the income obtained at the level of α = 0.05 significance. d) Establish and interpret the 95% confidence interval for β1.arrow_forward
- A sales manager wants to examine the relationship between the number of daily customers (x) and the revenue generated (y). For this purpose, he made observations in a randomly chosen 6 days for a store and observed the number of daily customers and the revenue (1000 TL). The personally created data set for the x and y variables is included in the attached “Homework data” file. Using the data set defined on your behalf; x1 x2 x3 x4 x5 x6 y1 y2 y3 y4 y5 y6 sb1 Burak data 74 86 96 105 110 124 290 307 331 406 421 481 0.491 d) Establish and interpret the 95% confidence interval for β1.arrow_forwardIdentify the description(s) that adhere to the requirements for testing a population correlation between variables X and Y. The log-transformed version of Y and X have a linear relationship. The shape of the scatter plot for the data collected for the X and Y variables is shaped like a funnel. The scatter plot for the data collected for the X and Y variables do not show any outliers. The frequency histograms for X and Y separately are each normally distributed.arrow_forwardThe data show the test results from students in two classrooms, one integrated and one not. There are two sets of test scores, a pre-test and a post-test for both groups. First, calculate a measure of change in the test scores for students in both groups. Then, use the resulting measure of change to compare both groups on the measure of change from the pre-test to the post-test. When finished, write a short summary of what you found, including: Group 1 mean Group 2 mean Ho and H1 t-observed t-criticalarrow_forward
- Turbid water is muddy or cloudy water. Sunlight is necessary for most life forms; thus turbid water is considered a threat to wetland ecosystems. Passive filtration systems are commonly used to reduce turbidity in wetlands. Suspended solids are measured in mg/l. Is there a relation between input and output turbidity for a passive filtration system and, if so, is it statistically significant? At a wetlands environment in Illinois, the inlet and outlet turbidity of a passive filtration system have been measured. A random sample of measurements are shown below. (Reference: EPA Wetland Case Studies.) Reading Inlet (mg/l) Outlet (mg/l) 3 4 5 6 7 8 9 10 11 12 31.6 86.9 87.0 12.0 45.4 43.3 32.3 77.7 71.7 85.9 64.9 80.1 3.3 14.2 16.8 5.7 4.6 6.2 3.4 7.7 8.0 7.4 8.7 14.3 Use a 1% level of significance to test the claim that there is a monotone relationship (either way) between the ranks of the inlet readings and outlet readings. (a) Rank-order the inlet readings using 1 as the largest data…arrow_forwardTurbid water is muddy or cloudy water. Sunlight is necessary for most life forms; thus turbid water is considered a threat to wetland ecosystems. Passive filtration systems are commonly used to reduce turbidity in wetlands. Suspended solids are measured in mg/l. Is there a relation between input and output turbidity for a passive filtration system and, if so, is it statistically significant? At a wetlands environment in Illinois, the inlet and outlet turbidity of a passive filtration system have been measured. A random sample of measurements are shown below. (Reference: EPA Wetland Case Studies.) Reading 1 2 3 4 5 6 7 8 9 10 11 12 Inlet (mg/l) 59.1 25.7 70.5 71.0 37.6 43.5 13.1 24.2 16.7 49.1 67.6 31.7 Outlet (mg/l) 18.2 14.3 15.3 17.5 13.1 8.0 4.1 4.4 4.3 5.8 16.3 7.1 Use a 1% level of significance to test the claim that there is a monotone relationship (either way) between the ranks of the inlet readings and outlet readings. (a) Rank-order the inlet readings using 1 as…arrow_forwardTurbid water is muddy or cloudy water. Sunlight is necessary for most life forms; thus turbid water is considered a threat to wetland ecosystems. Passive filtration systems are commonly used to reduce turbidity in wetlands. Suspended solids are measured in mg/l. Is there a relation between input and output turbidity for a passive filtration system and, if so, is it statistically significant? At a wetlands environment in Illinois, the inlet and outlet turbidity of a passive filtration system have been measured. A random sample of measurements are shown below. (Reference: EPA Wetland Case Studies.) Use a 1% level of significance to test the claim that there is a monotone relationship (either way) between the ranks of the inlet readings and outlet readings. (a) Rank-order the inlet readings using 1 as the largest data value. Also rank-order the outlet readings using 1 as the largest data value. Then construct a table of ranks to be used for a Spearman rank correlation test. (c) Compute…arrow_forward
- Turbid water is muddy or cloudy water. Sunlight is necessary for most life forms; thus turbid water is considered a threat to wetland ecosystems. Passive filtration systems are commonly used to reduce turbidity in wetlands. Suspended solids are measured in mg/l. Is there a relation between input and output turbidity for a passive filtration system and, if so, is it statistically significant? At a wetlands environment in Illinois, the inlet and outlet turbidity of a passive filtration system have been measured. A random sample of measurements are shown below. (Reference: EPA Wetland Case Studies.) Reading 1 2 3 4 5 6 7 8 9 10 11 12 Inlet (mg/l) 62.1 13.8 63.5 30.6 91.1 11.5 67.2 75.6 79.3 29.5 72.9 21.3 Outlet (mg/l) 11.3 2.7 7.5 12.3 12.9 3.8 13.3 13.2 15.1 6.0 7.0 4.7 Use a 1% level of significance to test the claim that there is a monotone relationship (either way) between the ranks of the inlet readings and outlet readings. (a) Rank-order the inlet readings using 1 as…arrow_forwardThe data in the accompanying table is from observing the count of bacteria. The COUNT (Y) is recorded in 1000's of a BACTERIA (X₁) and the growth rate, RATE (X₂) of a type of bacteria. Below is the data set to be used for analysis. Y COUNT 9 9.1 10.2 11.3 12.2 10.6 X₁ BACTERIA A A C B B C 2.1. Change the dataset into a usable format for modelling. X₂ RATE 0.15 014 0.08 0.12 0.16 0.01arrow_forwardcreate graph of the two-variable data with a regression line, r, r2, and separate residual plotarrow_forward
 Calculus For The Life SciencesCalculusISBN:9780321964038Author:GREENWELL, Raymond N., RITCHEY, Nathan P., Lial, Margaret L.Publisher:Pearson Addison Wesley,
 Algebra & Trigonometry with Analytic GeometryAlgebraISBN:9781133382119Author:SwokowskiPublisher:Cengage
 Glencoe Algebra 1, Student Edition, 9780079039897...AlgebraISBN:9780079039897Author:CarterPublisher:McGraw Hill