
Videos
Milk Production The data in the table below represent the number of dairy farms (in thousands) and the amount of milk produced (in billions of pounds) in the United States for various years.
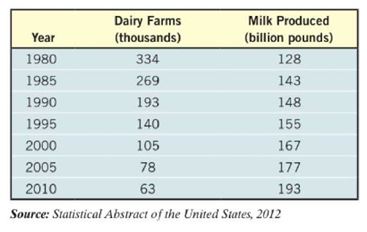
(a) Using a graphing utility, draw a
(b) Using a graphing utility, build a logarithmic model from the data.
(c) Graph the logarithmic function found in part (b) on the scatter diagram.
(d) In 2008, there were 67 thousand dairy farms in the United States. Use the function in part (b) to predict the amount of milk produced in 2008.
(e) The actual amount of milk produced in 2008 was 190 billion pounds. How does your prediction in part (d) compare to this?
Want to see the full answer?
Check out a sample textbook solution
Chapter 5 Solutions
Precalculus Enhanced With Graphing Utilities


- What type (s) of translation (s), if any, affect thedomain ofa logarithmic function?arrow_forwardWhat type (s) of translation(s), if any, affect the range of a logarithmic function?arrow_forwardDoes a linear, exponential, or logarithmic model best fit the data in Table 2? Find the model.arrow_forward
 Algebra & Trigonometry with Analytic GeometryAlgebraISBN:9781133382119Author:SwokowskiPublisher:Cengage
 College AlgebraAlgebraISBN:9781305115545Author:James Stewart, Lothar Redlin, Saleem WatsonPublisher:Cengage Learning
 Functions and Change: A Modeling Approach to Coll...AlgebraISBN:9781337111348Author:Bruce Crauder, Benny Evans, Alan NoellPublisher:Cengage Learning
 Glencoe Algebra 1, Student Edition, 9780079039897...AlgebraISBN:9780079039897Author:CarterPublisher:McGraw Hill
 College Algebra (MindTap Course List)AlgebraISBN:9781305652231Author:R. David Gustafson, Jeff HughesPublisher:Cengage Learning