
Essentials of Business Analytics (MindTap Course List)
2nd Edition
ISBN: 9781305627734
Author: Jeffrey D. Camm, James J. Cochran, Michael J. Fry, Jeffrey W. Ohlmann, David R. Anderson
Publisher: Cengage Learning
expand_more
expand_more
format_list_bulleted
Videos
Textbook Question
Chapter 6, Problem 17P
Health insurers are beginning to offer telemedicine services online that replace the common office visit. Wellpoint provides a video service that allows subscribers to connect with a physician online and receive prescribed treatments. Wellpoint claims that users of its LiveHealth Online service saved a significant amount of money on a typical visit. The data shown below ($), for a sample of 20 online doctor visits, are consistent with the savings per visit reported by Wellpoint.
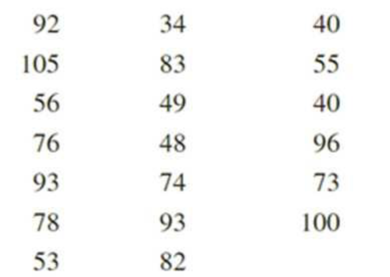
Assuming that the population is roughly symmetric, construct a 95% confidence interval for the mean savings for a televisit to the doctor as opposed to an office visit.
Expert Solution & Answer
Want to see the full answer?
Check out a sample textbook solution
Chapter 6 Solutions
Essentials of Business Analytics (MindTap Course List)
Ch. 6 - The American League consists of 15 baseball teams....Ch. 6 - The U.S. Golf Association is considering a ban on...Ch. 6 - A simple random sample of 5 months of sales data...Ch. 6 - Morningstar publishes ratings data on 1,208...Ch. 6 - One of the questions in the Pew Internet &...Ch. 6 - In this chapter we showed how a simple random...Ch. 6 - The College Board reported the following mean...Ch. 6 - Prob. 8PCh. 6 - The Economic Policy Institute periodically issues...Ch. 6 - The state of California has a mean annual rainfall...
Ch. 6 - The president of Doerman Distributors, Inc.,...Ch. 6 - Prob. 12PCh. 6 - People end up tossing 12% of what they buy at the...Ch. 6 - Prob. 14PCh. 6 - The International Air Transport Association...Ch. 6 - Prob. 16PCh. 6 - Health insurers are beginning to offer...Ch. 6 - The average annual premium for automobile...Ch. 6 - Prob. 19PCh. 6 - According to Thomson Financial, last year the...Ch. 6 - The Pew Research Center Internet Project conducted...Ch. 6 - For many years businesses have struggled with the...Ch. 6 - The manager of the Danvers-Hilton Resort Hotel...Ch. 6 - The manager of an automobile dealership is...Ch. 6 - A production line operation is designed to fill...Ch. 6 - Because of high production-changeover time and...Ch. 6 - Duke Energy reported that the cost of electricity...Ch. 6 - Prob. 28PCh. 6 - Carpetland salespersons average 8,000 per week in...Ch. 6 - Suppose a new production method will be...Ch. 6 - Prob. 31PCh. 6 - A shareholders’ group, in lodging a protest,...Ch. 6 - Prob. 33PCh. 6 - Prob. 34PCh. 6 - Prob. 35PCh. 6 - According to the National Automobile Dealers...Ch. 6 - What percentage of the population live in their...Ch. 6 - Prob. 38PCh. 6 - Ten years ago 53% of American families owned...Ch. 6 - Prob. 40PCh. 6 - Prob. 41PCh. 6 - Prob. 42PCh. 6 - The Port Authority sells a wide variety of cables...Ch. 6 - The Port Authority also wants to determine if the...Ch. 6 - Prob. 1C
Knowledge Booster


Learn more about
Need a deep-dive on the concept behind this application? Look no further. Learn more about this topic, statistics and related others by exploring similar questions and additional content below.Similar questions
- What does the y -intercept on the graph of a logistic equation correspond to for a population modeled by that equation?arrow_forwardUrban Travel Times Population of cities and driving times are related, as shown in the accompanying table, which shows the 1960 population N, in thousands, for several cities, together with the average time T, in minutes, sent by residents driving to work. City Population N Driving time T Los Angeles 6489 16.8 Pittsburgh 1804 12.6 Washington 1808 14.3 Hutchinson 38 6.1 Nashville 347 10.8 Tallahassee 48 7.3 An analysis of these data, along with data from 17 other cities in the United States and Canada, led to a power model of average driving time as a function of population. a Construct a power model of driving time in minutes as a function of population measured in thousands b Is average driving time in Pittsburgh more or less than would be expected from its population? c If you wish to move to a smaller city to reduce your average driving time to work by 25, how much smaller should the city be?arrow_forward
Recommended textbooks for you
 Linear Algebra: A Modern IntroductionAlgebraISBN:9781285463247Author:David PoolePublisher:Cengage Learning
 Functions and Change: A Modeling Approach to Coll...AlgebraISBN:9781337111348Author:Bruce Crauder, Benny Evans, Alan NoellPublisher:Cengage Learning
 Glencoe Algebra 1, Student Edition, 9780079039897...AlgebraISBN:9780079039897Author:CarterPublisher:McGraw Hill
Linear Algebra: A Modern Introduction
Algebra
ISBN:9781285463247
Author:David Poole
Publisher:Cengage Learning
Functions and Change: A Modeling Approach to Coll...
Algebra
ISBN:9781337111348
Author:Bruce Crauder, Benny Evans, Alan Noell
Publisher:Cengage Learning
Glencoe Algebra 1, Student Edition, 9780079039897...
Algebra
ISBN:9780079039897
Author:Carter
Publisher:McGraw Hill
Hypothesis Testing using Confidence Interval Approach; Author: BUM2413 Applied Statistics UMP;https://www.youtube.com/watch?v=Hq1l3e9pLyY;License: Standard YouTube License, CC-BY
Hypothesis Testing - Difference of Two Means - Student's -Distribution & Normal Distribution; Author: The Organic Chemistry Tutor;https://www.youtube.com/watch?v=UcZwyzwWU7o;License: Standard Youtube License