
Essentials of Business Analytics (MindTap Course List)
2nd Edition
ISBN: 9781305627734
Author: Jeffrey D. Camm, James J. Cochran, Michael J. Fry, Jeffrey W. Ohlmann, David R. Anderson
Publisher: Cengage Learning
expand_more
expand_more
format_list_bulleted
Concept explainers
Videos
Textbook Question
Chapter 6, Problem 18P
The average annual premium for automobile insurance in the United States is $1,503. The following annual premiums ($) are representative of the web site’s findings for the state of Michigan.
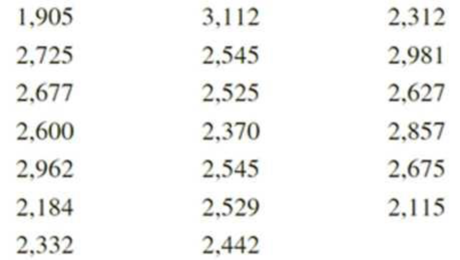
Assume the population is approximately normal.
- a. Provide a point estimate of the
mean annual automobile insurance premium in Michigan. - b. Develop a 95% confidence interval for the mean annual automobile insurance premium in Michigan.
- c. Does the 95% confidence interval for the annual automobile insurance premium in Michigan include the national average for the United States? What is your interpretation of the relationship between auto insurance premiums in Michigan and the national average?
Expert Solution & Answer
Want to see the full answer?
Check out a sample textbook solution
Students have asked these similar questions
Use the accompanying Grade Point Averages data to find 90%, 95%, and 99% confidence intervals for the mean GPA.
Given the following data, find the LOWER endpoint for a 95% confidence interval for .
21,39,23,27,22,46
The following data give the ages of 36 randomly selected family caregivers of olderparents in the United States:55 53 47 47 49 43 47 40 48 41 44 51 48 43 50 49 47 4242 47 47 49 46 46 43 41 45 51 44 48 43 50 53 44 49 53Assuming normality,(a) Determine a 95% confidence interval for the mean ages of all US caregivers.(b) Determine a one-sided lower and one-sided upper 95% confidence interval forthe mean ages of all US caregivers.
Chapter 6 Solutions
Essentials of Business Analytics (MindTap Course List)
Ch. 6 - The American League consists of 15 baseball teams....Ch. 6 - The U.S. Golf Association is considering a ban on...Ch. 6 - A simple random sample of 5 months of sales data...Ch. 6 - Morningstar publishes ratings data on 1,208...Ch. 6 - One of the questions in the Pew Internet &...Ch. 6 - In this chapter we showed how a simple random...Ch. 6 - The College Board reported the following mean...Ch. 6 - Prob. 8PCh. 6 - The Economic Policy Institute periodically issues...Ch. 6 - The state of California has a mean annual rainfall...
Ch. 6 - The president of Doerman Distributors, Inc.,...Ch. 6 - Prob. 12PCh. 6 - People end up tossing 12% of what they buy at the...Ch. 6 - Prob. 14PCh. 6 - The International Air Transport Association...Ch. 6 - Prob. 16PCh. 6 - Health insurers are beginning to offer...Ch. 6 - The average annual premium for automobile...Ch. 6 - Prob. 19PCh. 6 - According to Thomson Financial, last year the...Ch. 6 - The Pew Research Center Internet Project conducted...Ch. 6 - For many years businesses have struggled with the...Ch. 6 - The manager of the Danvers-Hilton Resort Hotel...Ch. 6 - The manager of an automobile dealership is...Ch. 6 - A production line operation is designed to fill...Ch. 6 - Because of high production-changeover time and...Ch. 6 - Duke Energy reported that the cost of electricity...Ch. 6 - Prob. 28PCh. 6 - Carpetland salespersons average 8,000 per week in...Ch. 6 - Suppose a new production method will be...Ch. 6 - Prob. 31PCh. 6 - A shareholders’ group, in lodging a protest,...Ch. 6 - Prob. 33PCh. 6 - Prob. 34PCh. 6 - Prob. 35PCh. 6 - According to the National Automobile Dealers...Ch. 6 - What percentage of the population live in their...Ch. 6 - Prob. 38PCh. 6 - Ten years ago 53% of American families owned...Ch. 6 - Prob. 40PCh. 6 - Prob. 41PCh. 6 - Prob. 42PCh. 6 - The Port Authority sells a wide variety of cables...Ch. 6 - The Port Authority also wants to determine if the...Ch. 6 - Prob. 1C
Knowledge Booster


Learn more about
Need a deep-dive on the concept behind this application? Look no further. Learn more about this topic, statistics and related others by exploring similar questions and additional content below.Similar questions
- Four math majors received the following salary offers upon graduation: $48,000, $55,000, $42,000 and $51,000. Assuming all assumptions are met, establish a 95 percent confidence interval for the population mean. (?)49,000±1.96(54773√)(a)49,000±1.96(54773) (?)49,000±2.776(54774√)(b)49,000±2.776(54774) (?)49,000±2.776(54773√)(c)49,000±2.776(54773) (?)49,000±3.182(54773√)(d)49,000±3.182(54773) (?)49,000±3.182(54774√)arrow_forwardWhich of the following confidence levels and significance levels are appropriate for using a confidence interval approach to hypothesis testing? Confidence Level = 99% and α = 0.01 Confidence Level = 95% and α = 0.01 Confidence Level = 95% and α = 0.5 Confidence Level = 90% and α = 0.01arrow_forwardUse the given data to construct a confidence interval for the population proportion of the requested level.arrow_forward
- Given the following confidence interval for a population mean, compute the margin of error, E. 18.23<μ<18.75arrow_forwardGiven the following information, what is the confidence interval for the population mean? Weight loss on a diet: 90% confidence, n=61, sample mean=3.0 kg, stdev=5.1 kgarrow_forwardConsider the following results for independent samples taken from two populations. Sample 1 Sample 2 n1 400 n2 300 p1 0.48 p2 0.36 What is the point estimate of the difference between the two population proportions? Construct a 90 per cent confidence interval for the difference between the two population proportions. Construct a 95 per cent confidence interval for the difference between the two population proportions.arrow_forward
- A random sample of 34 participants in a Zumba dance class had their heart rates measured before and after a moderate 10-minute workout. The following data correspond to the increase in each individual’s heart rate (in beats per minute): 59 70 57 42 57 59 41 54 44 36 59 61 52 42 41 32 60 54 52 53 51 47 62 62 44 69 50 37 50 54 48 52 61 45 What is the point estimate of the corresponding population mean? Make a 98% confidence interval for the average increase in a person’s heart rate after a moderate 10-minute Zumba workout. Suppose the confidence interval obtained in part a is too wide. How can the width of this interval be reduced? Describe all possible alternatives. Which alternative is the best and why?arrow_forwardIn the table below, average years of education are reported by social class based on data from the 2018 General Social Survey. Mean Standard Deviation N Lower class 12.19 3.08 102 Working class 13.16 2.93 523 Middle class 14.60 2.88 498 Upper class 15.21 3.01 34 Construct the 95% confidence interval for the mean number of years of education for lower- and working-class respondents. Construct the 99% confidence interval for the mean number of years of education for lower-class and middle-class respondents.arrow_forward
arrow_back_ios
arrow_forward_ios
Recommended textbooks for you
 Glencoe Algebra 1, Student Edition, 9780079039897...AlgebraISBN:9780079039897Author:CarterPublisher:McGraw Hill
Glencoe Algebra 1, Student Edition, 9780079039897...
Algebra
ISBN:9780079039897
Author:Carter
Publisher:McGraw Hill
Which is the best chart: Selecting among 14 types of charts Part II; Author: 365 Data Science;https://www.youtube.com/watch?v=qGaIB-bRn-A;License: Standard YouTube License, CC-BY