
FINANCIAL ACCOUNTING (CUSTOM)
17th Edition
ISBN: 9781307138146
Author: PHILLIPS
Publisher: Mcgraw-Hill/Create
expand_more
expand_more
format_list_bulleted
Videos
Textbook Question
Chapter 6, Problem 18E
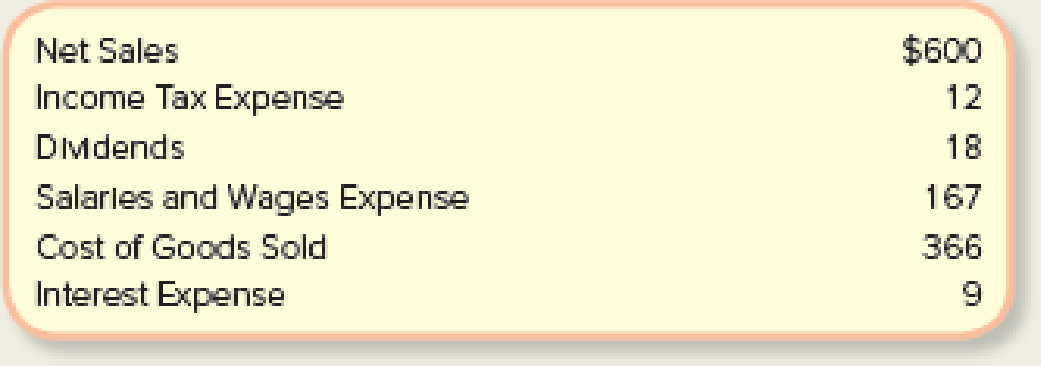
Analyzing Gross Profit Percentage on the Basis of an Income Statement
Wolverine World Wide, Inc., prides itself as being the “world’s leading marketer of U.S. branded non-athletic footwear.” The following data (in millions) were reported for the third quarter of 2016:
Required:
- 1. Based on these data, prepare a multistep income statement.
- 2. How much was the gross profit in dollars? What was the gross profit percentage? (Round to one decimal place.) Explain what these two amounts mean.
- 3. Did the gross profit percentage in the current quarter improve, or decline, relative to the 38.8% gross profit percentage in the prior quarter?
Expert Solution & Answer
Want to see the full answer?
Check out a sample textbook solution
Students have asked these similar questions
Vertical analysis (common-size) percentages for Baker Company’s sales revenue, cost of goods sold, and expenses are as follows. Did Baker’s net income as a percent of sales increase, decrease, or remain unchanged over the 3-year period? Provide numerical support for your answer.
Vertical Analysis
2018
2017
2016
Sales revenue
100.0%
100.0%
100.0%
Cost of goods sold
60.0
63.9
65.0
Expenses
26.0
26.6
27.5
In its year-end financial statements, Pillar Inc. reported the following (in millions):
2016
2015
Sales
$38,152
$46,541
Cost of goods sold
$28,309
$33,211
As a percentage of sales, did Pillar's gross profit increase or decrease during the year?
Select one:
a. Gross profit decreased from 28.6% to 25.8%
b. Gross profit increased from 71.4% to 74.2%
c. Gross profit decreased from 74.2% to 71.4%
d. There is not enough information to answer the question.
e. Gross profit increased from 25.8% to 28.6%
Working with the Takeaways throughout this chapter we have considered the financial statements of Apple Inc. and have undertaken select financial analysis using the Takeaways. Utilize
these same tools to analyze the financial data of
Logitech International, a manufacturer of computer peripherals. The following information was reported by Logitech in the company’s financial statements as of year-end March 31, 2017 and 2016.1. Calculate the return on sales ratio for each year and comment on Logitech’s profitability.2. Calculate the current ratio for each year and comment on Logitech’s liquidity.3. Calculate the debt-to-total-assets ratio for each year and comment on Logitech’s solvency. 4. Calculate the free cash flow for each year and comment on what this means for Logitech. 5. Apple’s fiscal year-end occurs near the end of September, whereas Logitech uses a March year-end. How might this affect a comparison of the financial results of the two companies?
Chapter 6 Solutions
FINANCIAL ACCOUNTING (CUSTOM)
Ch. 6 - Prob. 1QCh. 6 - If a Chicago-based company ships goods on...Ch. 6 - Define goods available for sale. How does it...Ch. 6 - Define beginning inventory and ending inventory.Ch. 6 - Describe how transportation costs to obtain...Ch. 6 - What is the main distinction between perpetual and...Ch. 6 - Why is a physical count of inventory necessary in...Ch. 6 - What is the difference between FOB shipping point...Ch. 6 - Describe in words the journal entries that are...Ch. 6 - What is the distinction between Sales Returns and...
Ch. 6 - Prob. 11QCh. 6 - In response to the weak economy, your companys...Ch. 6 - Prob. 13QCh. 6 - Why are contra-revenue accounts used rather than...Ch. 6 - What is gross profit? How is the gross profit...Ch. 6 - Prob. 1MCCh. 6 - Prob. 2MCCh. 6 - Prob. 3MCCh. 6 - Prob. 4MCCh. 6 - Prob. 5MCCh. 6 - Prob. 6MCCh. 6 - Prob. 7MCCh. 6 - Prob. 8MCCh. 6 - A company bundles a product and service that...Ch. 6 - Prob. 10MCCh. 6 - Distinguishing among Operating Cycles Identify the...Ch. 6 - Calculating Shrinkage in a Perpetual Inventory...Ch. 6 - Accounting for Inventory Transportation Costs XO...Ch. 6 - Prob. 4MECh. 6 - Evaluating Inventory Cost Components Assume...Ch. 6 - Recording Journal Entries for Purchases and Safes...Ch. 6 - Prob. 7MECh. 6 - Prob. 8MECh. 6 - Prob. 9MECh. 6 - Prob. 10MECh. 6 - Calculating Shrinkage and Gross Profit in a...Ch. 6 - Prob. 12MECh. 6 - Preparing a Multistep Income Statement Sellall...Ch. 6 - Computing and Interpreting the Gross Profit...Ch. 6 - Computing and Interpreting the Gross Profit...Ch. 6 - Interpreting Changes in Gross Profit Percentage...Ch. 6 - Determining the Cause of Increasing Gross Profit...Ch. 6 - Understanding Relationships among Gross Profit and...Ch. 6 - Prob. 19MECh. 6 - Recording Journal Entries for Purchase Discounts...Ch. 6 - Recording Journal Entries for Sales and Sales...Ch. 6 - Recording Journal Entries for Sales and Sales...Ch. 6 - Prob. 23MECh. 6 - Prob. 24MECh. 6 - Relating Financial Statement Reporting to Type of...Ch. 6 - Inferring Merchandise Purchases The Gap, Inc., is...Ch. 6 - Identifying Shrinkage and Other Missing inventory...Ch. 6 - Prob. 4ECh. 6 - Prob. 5ECh. 6 - Inferring Missing Amounts Based on Income...Ch. 6 - Reporting Purchases and Purchase Discounts Using a...Ch. 6 - Reporting Purchases, Purchase Discounts, and...Ch. 6 - Items Included in Inventory PCM, Inc., is a direct...Ch. 6 - Prob. 10ECh. 6 - Reporting Net Sales after Sales Discounts The...Ch. 6 - Reporting Net Sales after Sales Discounts and...Ch. 6 - Determining the Effects of Credit Sales, Sales...Ch. 6 - Analyzing and Recording Sales and Gross Profit...Ch. 6 - Prob. 15ECh. 6 - Inferring Missing Amounts Based on Income...Ch. 6 - Analyzing Gross Profit Percentage on the Basis of...Ch. 6 - Analyzing Gross Profit Percentage on the Basis of...Ch. 6 - (Supplement 6A) Recording Journal Entries for...Ch. 6 - (Supplement 6A) Recording Journal Entries for...Ch. 6 - (Supplement 6A) Recording Journal Entries for...Ch. 6 - (Supplement 6A) Recording Journal Entries for...Ch. 6 - Prob. 23ECh. 6 - Prob. 24ECh. 6 - (Supplement 6A) Recording Journal Entries for Net...Ch. 6 - Prob. 26ECh. 6 - Prob. 27ECh. 6 - Prob. 28ECh. 6 - (Supplement 6A) Recording Purchases and Sales...Ch. 6 - Purchase Transactions between Wholesale and Retail...Ch. 6 - Prob. 2CPCh. 6 - Recording Cash Sales, Credit Sales, Sales Returns,...Ch. 6 - Prob. 4CPCh. 6 - Preparing a Multistep Income Statement and...Ch. 6 - (Supplement A) Recording Inventory Transactions...Ch. 6 - Reporting Purchase Transactions between Wholesale...Ch. 6 - Reporting Sales Transactions between Wholesale and...Ch. 6 - Recording Sales with Discounts and Returns and...Ch. 6 - Prob. 4PACh. 6 - Preparing a Multistep Income Statement and...Ch. 6 - (Supplement A) Recording Inventory Transactions...Ch. 6 - Reporting Purchase Transactions between Wholesale...Ch. 6 - Prob. 2PBCh. 6 - Prob. 3PBCh. 6 - Prob. 4PBCh. 6 - Preparing a Multistep Income Statement and...Ch. 6 - (Supplement A) Recording Inventory Transactions...Ch. 6 - Reporting Cash, Inventory Orders, Purchases,...Ch. 6 - Preparing Journal Entries for Inventory Purchases,...Ch. 6 - Finding Financial Information Refer to the...Ch. 6 - Prob. 2SDCCh. 6 - Ethical Decision Making: A Mini-Case Assume you...Ch. 6 - Prob. 5SDCCh. 6 - Preparing Multistep Income Statements and...Ch. 6 - Prob. 1CC
Knowledge Booster


Learn more about
Need a deep-dive on the concept behind this application? Look no further. Learn more about this topic, accounting and related others by exploring similar questions and additional content below.Similar questions
- Common-Sized Income Statement Revenue and expense data for the current calendar year for Sorenson Electronics Company and for the electronics industry are as follows. Sorenson Electronics Company data are expressed in dollars. The electronics industry averages are expressed in percentages. SorensonElectronicsCompany ElectronicsIndustryAverage Sales $1,940,000 100 % Cost of goods sold (1,358,000) (76) Gross profit $582,000 24 % Selling expenses $(329,800) (9) % Administrative expenses (116,400) (9) Total operating expenses $(446,200) (18) % Operating income $135,800 6 % Other revenue and expense: Other revenue 38,800 4 Other expense (19,400) (3) Income before income tax $155,200 7 % Income tax expense (58,200) (5) Net income $97,000 2 % a. Prepare a common-sized income statement comparing the results of operations for Sorenson Electronics Company with the industry average. If…arrow_forwardCommon-Sized Income Statement Revenue and expense data for the current calendar year for Tannenhill Company and for the electronics industry are as follows. Tannenhill’s data are expressed in dollars. The electronics industry averages are expressed in percentages. TannenhillCompany ElectronicsIndustryAverage Sales $2,740,000 100 % Cost of goods sold 1,753,600 69 Gross profit $986,400 31 % Selling expenses $602,800 18 % Administrative expenses 219,200 7 Total operating expenses $822,000 25 % Operating income $164,400 6 % Other revenue 54,800 2 $219,200 8 % Other expense 27,400 1 Income before income tax $191,800 7 % Income tax expense 82,200 5 Net income $109,600 2 % a. Prepare a common-sized income statement comparing the results of operations for Tannenhill Company with the industry average. If required, round percentages to one decimal place. Enter all amounts as positive…arrow_forwardCommon-Sized Income Statement Revenue and expense data for the current calendar year for Tannenhill Company and for the electronics industry are as follows. Tannenhill's data are expressed in dollars. The electronics industry averages are expressed in percentages. TannenhillCompany ElectronicsIndustryAverage Sales $4,000,000 100.0 % Cost of goods sold (2,120,000) (60.0) Gross profit $1,880,000 40.0 % Selling expenses $(1,080,000) (24.0) % Administrative expenses (640,000) (14.0) Total operating expenses $(1,720,000) (38.0) % Operating income $160,000 2.0 % Other revenue and expense: Other revenue 120,000 3.0 Other expense (80,000) (2.0) Income before income tax expense $200,000 3.0 % Income tax expense (80,000) (2.0) Net income $120,000 1.0 % a. Prepare a common-sized income statement comparing the results of operations for Tannenhill Company with the…arrow_forward
- The Cullumber Supply Company reported the following information for 2017. Prepare a common-size income statement for the year ended June 30, 2017. (Round answers to 1 decimal place, e.g. 52.7%.) Cullumber Supply CompanyIncome Statement for the Fiscal Year Ended June 30, 2017($ thousands) % of Net Sales Net sales $2,111,000 enter percentages of net sales % Cost of goods sold 1,464,000 enter percentages of net sales % Selling and administrative expenses 312,200 enter percentages of net sales % Nonrecurring expenses 27,600 enter percentages of net sales % Earnings before interest, taxes, depreciation, and amortization (EBITDA) $307,200 enter percentages of net sales % Depreciation 117,000 enter percentages of net sales % Earnings before interest and taxes (EBIT) 190,200 enter percentages of net sales % Interest expense 118,600 enter percentages of net sales % Earnings before taxes (EBT)…arrow_forwardUse the following information for Short Exercises S15-6 through S15-10. Accel’s Companies, a home improvement store chain, reported the following summarized figures: Requirements Compute the profit margin ratio for Accel’s Companies for 2018. Compute the rate of return on total assets for 2018.arrow_forwardCalculate gross profit, cost of goods sold, and selling price MBI, Inc., had sales of $600 million for fiscal 2016. The company’s gross profit ratio for that year was 31.2%.Required:a. Calculate the gross profit and cost of goods sold for MBI, Inc., for fiscal 2016.b. Assume that a new product is developed and that it will cost $1,634 to manufacture. Calculate the selling price that must be set for this new product if its gross profit ratio is to be the same as the average achieved for all products for fiscal 2016.c. From a management viewpoint, what would you do with this information?arrow_forward
- Mac Donald company reported the following on its comparative income statement: 2017 2018 2019 Revenue 9,000 10,000 14,000 Cost of goods sold 6,000 4,000 9,000 Prepare a horizontal analysis of revenue , cost of goods sold and gross profitarrow_forwardPresented below is information for Oakley Company for the month of March 2020. Cost of goods sold $254,000 Rent expense $36,000 Freight-out 7,500 Sales discounts 8,800 Insurance expense 5,000 Sales returns and allowances 11,000 Salaries and wages expense 75,000 Sales revenue 425,000 (a) Your Answer Correct Answer Partially correct answer iconYour answer is partially correct. Prepare a multiple-step income statement. OAKLEY COMPANYIncome Statement For the Year Ended March 31, 2016March 31, 2020For the Month Ended March 31, 2020 Owner's Capital, March 31Operating ExpensesNet Income / (Loss)RevenuesGross Profit / (Loss)InvestmentsOwner's Capital, March 1Net SalesTotal Operating ExpensesDrawings $…arrow_forwardComplete the horizontal analysis below. Use the name of the company you belong to in your iLS Activity. Round off your answers to the nearest hundredths. Name: Income Statement for the years ending December 31, 201X and December 31, 201Y 2015 2016 Annual Percentage Growth 2015-2016 Sales 475,000 500,000 1. Cost of Goods Sold 265,000 269,000 2. Gross Profit 210,000 231,000 3. Wages 154,000 163,000 4. Repairs 5,800 4,150 5. Rent 13,000 12,000 6. Taxes 16,940 17,930 7. Office Expenses 1,023 587 8. Total…arrow_forward
- Complete the horizontal analysis below. Use the name of the company you belong to in your iLS Activity. Round off your answers to the nearest hundredths. Name: Income Statement for the years ending December 31, 201X and December 31, 201Y 2015 2016 Annual Percentage Growth 2015-2016 Sales 475,000 500,000 1. Cost of Goods Sold 265,000 269,000 2. Gross Profit 210,000 231,000 3. Wages 154,000 163,000 4. Repairs 5,800 4,150 5. Rent 13,000 12,000 6. Taxes 16,940 17,930 7. Office Expenses 1,023 587 8. Total…arrow_forwardIndustry, Delete any companies with missing data for AT, SALE, IB Using Your industry (from question title), please answer these questions using Fiscal year 2015 data, use Total Assets (AT) for average investment, Income Before Extraordinary Items (IB) for income, and Sales/Turnover (Net) (SALE) for Sales Revenue What is the average Sales Margin for your industry? Answer in percentage, to the nearest hundredth of a percent, without the % sign, example 3.45 for 3.45%, 0.45 for 0.45% What is the average Turnover for your industry Answer to the nearest hundredth What is the average Return on Investment for your industry Answer in percentage, to the nearest hundredth of a percent, without the % sign, example 3.45 for 3.45% Which company (use Global Company Key) has the highest ROI in your Industry? Answer with no leading zeros using the appropriate number of digitsarrow_forwardIncome statements (in’000s) of Future Lifestyle and Arvind Lifestyle, the two top textile brands, are provided below. Future lifestyle profits declined in 2014-15. Although Arvind lifestyle posted loss in both periods, the loss has declined. Required: a. Examine the performance of Future Lifestyle for the two years and explain why profit has declined despite increase in revenue. b. Examine how the performance of Arvind Lifestyle for the two years and explain how Arvind lifestyle improved its performance. c. Compare the performance of the two companies for the year ending March 2015 and explain the differences in performance of the two companies. (Hint: Prepare common size income statement to analyse the cost structure of the two companies). Future Lifestyle Arvind Lifestyle March 2014 March 2015 March 2014 March 2015 INCOME Revenue 3122.86 3305.58 1764.95 2291.08 EXPENDITURE Raw Materials…arrow_forward
arrow_back_ios
SEE MORE QUESTIONS
arrow_forward_ios
Recommended textbooks for you
 Cornerstones of Financial AccountingAccountingISBN:9781337690881Author:Jay Rich, Jeff JonesPublisher:Cengage Learning
Cornerstones of Financial Accounting
Accounting
ISBN:9781337690881
Author:Jay Rich, Jeff Jones
Publisher:Cengage Learning
How To Analyze an Income Statement; Author: Daniel Pronk;https://www.youtube.com/watch?v=uVHGgSXtQmE;License: Standard Youtube License