
Concept explainers
Videos
Bone Density Test. In Exercises 1–4, assume that scores on a bone mineral density test are
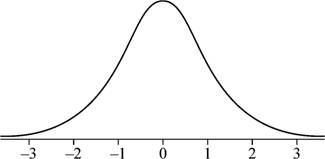
1. Bone Density Sketch a graph showing the shape of the distribution of bone density test scores.
To sketch: The graph showing the shape of the distribution of the bone mineral density test scores.
Answer to Problem 1CQQ
Explanation of Solution
Given info:
The bone density test scores follow a normal distribution with mean of 0 and standard deviation of 1.
Justification:
Here, the bone density test follows a normal distribution. Also, the graph of the normal distribution is bell shaped and is symmetric about the mean. Moreover, if the mean and standard deviation are 0 and 1, respectively, the distribution is known as standard normal distribution. Hence, the graph of the bone density test scores is bell-shaped
Want to see more full solutions like this?
Chapter 6 Solutions
Pearson eText for Essentials of Statistics -- Instant Access (Pearson+)


- The table below shows the frequency distribution of the rainfall on 52 consecutive Wednesdays in a certain city. use the frequency distribution to construct a histogram. Do data appear to have a distribution that is approximately normal?arrow_forwardLarge Data Sets from Appendix B. In Exercises 25–28, use the data set from Appendix B to test the given claim. Use the P-value method unless your instructor specifies otherwise. Diastolic Blood Pressure for Men Repeat the preceding exercise for adult males instead of adult females.arrow_forwardShow work Researchers conducting a study of 15 children with a diagnosis of ADHD wish to assess whether the BMI of the children is correlated with degrees of hyperactivity in the child. The BMI of the children is shown in the image. What is the minimum BMI value in the study?arrow_forward
- (Use SPSS) A random sample of nine male race horses at a Fauquier County stable yielded the following data on age of horse (months) and time to run a mile (seconds). Age of Horse (x) 22 27 62 47 38 ☐32 55 50 58 Time to Run a Mile (y) 96 102 158 125 113 107 142 139 141 a. Construct a scatterplot of the data. What does it suggest about the relationship between the age and speed of male race horses in Fauquier County? b. Assuming that the simple linear regression model is appropriate, obtain the equation of the estimated regression line. c. What percentage of the observed variation in Time to Run a Mile can be explained by the resulting model? d. Check the regression assumptions using a normal probability plot of the residuals and a plot of the explanatory variable values versus the studentized residuals. e. A race horse trainer in Fauquier County claimed that there is a useful linear relationship between the two variables. Do you agree? Carry out a formal hypothesis test to support your…arrow_forwardThe data show the population (in thousands) for a recent year of a sample of aities in South Carolina. 24 19 19 18 62 18 21 24 20 11 22 33 93 13 21 29 13 12 108 45 20 46 108 39 30 51 Send data to Excel Part 1 of 8 The data value 21 corresponds to the 41" percentile. Part: 1/8 Part 2 of 8 The data value corresponds to the 71" percentile.arrow_forwardShow work Researchers conducting a study of 15 children with a diagnosis of ADHD wish to assess whether the BMI of the children is correlated with degrees of hyperactivity in the child. The BMI of the children is shown in the image. What is the maximum BMI value in the study?arrow_forward
- Compute a 95% CI for the mean age.arrow_forwardComparing z-Scores from Different Data Sets The table shows population statistics for the ages of Best Actor and Best Supporting Actor winners at the Academy Awards from 1929 to 2016. The distributions of the ages are approximately bell-shaped. In Exercise 52, compare the z-scores for the actors. 52. Best Actor 2005: Jamie Foxx, Age: 37 Best Supporting Actor 2005: Morgan Freeman, Age: 67 Please show any work :) .arrow_forwardTemperature Gas Usage (thm) 37 1250 39 1375 41 980 44 875 47 750 48 730 49 765 53 510 56 480 58 300 A) Graph data and find axis, line of best fit (get exact values, round to three decimal places as needed). B) Pick one independent point and calculate expected value. Compare results of observed value. C) Calculate r-value and explain in context.arrow_forward
 Glencoe Algebra 1, Student Edition, 9780079039897...AlgebraISBN:9780079039897Author:CarterPublisher:McGraw Hill
 Big Ideas Math A Bridge To Success Algebra 1: Stu...AlgebraISBN:9781680331141Author:HOUGHTON MIFFLIN HARCOURTPublisher:Houghton Mifflin Harcourt