
Pearson eText for Essentials of Statistics -- Instant Access (Pearson+)
6th Edition
ISBN: 9780137517374
Author: Mario Triola
Publisher: PEARSON+
expand_more
expand_more
format_list_bulleted
Concept explainers
Videos
Textbook Question
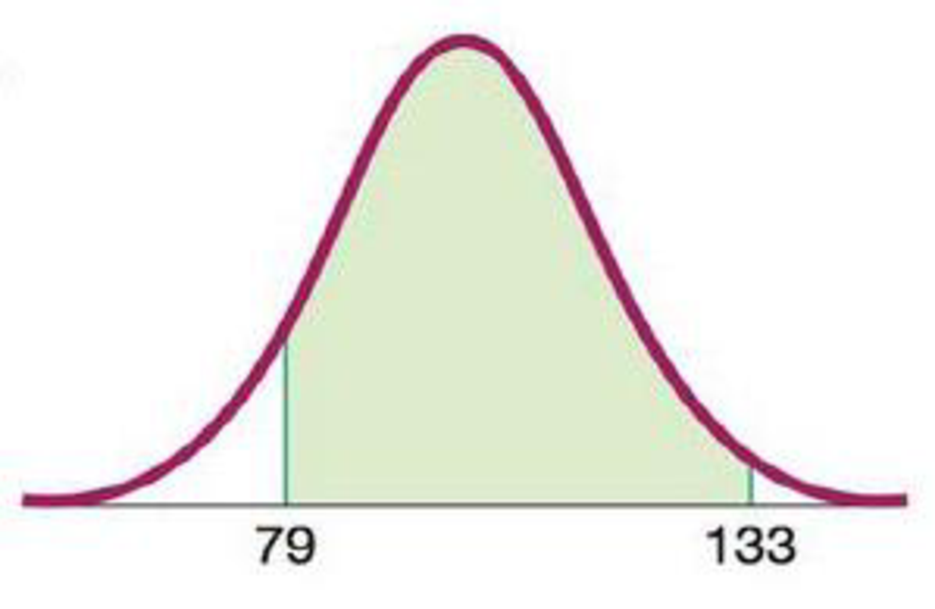
Chapter 6.2, Problem 7BSC
IQ Scores. In Exercises 5–8, find the area of the shaded region. The graphs depict IQ scores of adults, and those scores are
7.
Expert Solution & Answer

Learn your wayIncludes step-by-step video

schedule03:03
Students have asked these similar questions
(2) Look at the dotplot of the data below:
200 400 600 800 1000 1200
CHOL
a. Estimate (don't calculate) the mean.
1
MATH16 - ELEMENTARY STATISTICS WRITTEN HW #3 - SECTIONS 3.1 - 3.3
b. Would you expect the median to be less than / more than / or approximately
equal to the mean? Explain your reasoning.
Hello, I would need some help with part a, c, and d?
bartam
40.
GUeTticient of skewness and interpret the result :
Age below (yrs)
No. of employees
25
8.
30
20
35
40
40
65
45
80
50
92
55
100
Chapter 6 Solutions
Pearson eText for Essentials of Statistics -- Instant Access (Pearson+)
Ch. 6.1 - Normal Distribution Whats wrong with the following...Ch. 6.1 - Normal Distribution A normal distribution is...Ch. 6.1 - Standard Normal Distribution Identify the two...Ch. 6.1 - Notation What does the notation z indicate?Ch. 6.1 - Continuous Uniform Distribution. In Exercises 58,...Ch. 6.1 - Continuous Uniform Distribution. In Exercises 58,...Ch. 6.1 - Continuous Uniform Distribution. In Exercises 58,...Ch. 6.1 - Continuous Uniform Distribution. In Exercises 58,...Ch. 6.1 - Standard Normal Distribution. In Exercises 912,...Ch. 6.1 - Standard Normal Distribution. In Exercises 912,...
Ch. 6.1 - Standard Normal Distribution. In Exercises 912,...Ch. 6.1 - Standard Normal Distribution. In Exercises 912,...Ch. 6.1 - Standard Normal Distribution. In Exercises 1316,...Ch. 6.1 - Standard Normal Distribution. In Exercises 1316,...Ch. 6.1 - Standard Normal Distribution. In Exercises 1316,...Ch. 6.1 - Standard Normal Distribution. In Exercises 1316,...Ch. 6.1 - Standard Normal Distribution. In Exercises 1736,...Ch. 6.1 - Standard Normal Distribution. In Exercises 1736,...Ch. 6.1 - Standard Normal Distribution. In Exercises 1736,...Ch. 6.1 - Standard Normal Distribution. In Exercises 1736,...Ch. 6.1 - Standard Normal Distribution. In Exercises 1736,...Ch. 6.1 - Standard Normal Distribution. In Exercises 1736,...Ch. 6.1 - Standard Normal Distribution. In Exercises 1736,...Ch. 6.1 - Standard Normal Distribution. In Exercises 1736,...Ch. 6.1 - Standard Normal Distribution. In Exercises 1736,...Ch. 6.1 - Standard Normal Distribution. In Exercises 1736,...Ch. 6.1 - Standard Normal Distribution. In Exercises 1736,...Ch. 6.1 - Standard Normal Distribution. In Exercises 1736,...Ch. 6.1 - Standard Normal Distribution. In Exercises 1736,...Ch. 6.1 - Standard Normal Distribution. In Exercises 1736,...Ch. 6.1 - Standard Normal Distribution. In Exercises 1736,...Ch. 6.1 - Standard Normal Distribution. In Exercises 1736,...Ch. 6.1 - Standard Normal Distribution. In Exercises 1736,...Ch. 6.1 - Standard Normal Distribution. In Exercises 1736,...Ch. 6.1 - Standard Normal Distribution. In Exercises 1736,...Ch. 6.1 - Standard Normal Distribution. In Exercises 1736,...Ch. 6.1 - Finding Bone Density Scores. In Exercises 3740...Ch. 6.1 - Finding Bone Density Scores. In Exercises 3740...Ch. 6.1 - Finding Bone Density Scores. In Exercises 3740...Ch. 6.1 - Finding Bone Density Scores. In Exercises 3740...Ch. 6.1 - Critical Values. In Exercises 4144, find the...Ch. 6.1 - Critical Values. In Exercises 4144, find the...Ch. 6.1 - Critical Values. In Exercises 4144, find the...Ch. 6.1 - Critical Values. In Exercises 4144, find the...Ch. 6.1 - Basis for the Range Rule of Thumb and the...Ch. 6.1 - Basis for the Range Rule of Thumb and the...Ch. 6.1 - Basis for the Range Rule of Thumb and the...Ch. 6.1 - Basis for the Range Rule of Thumb and the...Ch. 6.1 - Significance For bone density scores that are...Ch. 6.1 - Distributions In a continuous uniform...Ch. 6.2 - Birth Weights Based on Data Set 4 Births in...Ch. 6.2 - Birth Weights Based on Data Set 4 Births in...Ch. 6.2 - Normal Distributions What is the difference...Ch. 6.2 - Random Digits Computers are commonly used to...Ch. 6.2 - IQ Scores. In Exercises 58, find the area of the...Ch. 6.2 - IQ Scores. In Exercises 58, find the area of the...Ch. 6.2 - IQ Scores. In Exercises 58, find the area of the...Ch. 6.2 - IQ Scores. In Exercises 58, find the area of the...Ch. 6.2 - IQ Scores. In Exercises 912, find the indicated IQ...Ch. 6.2 - IQ Scores. In Exercises 912, find the indicated IQ...Ch. 6.2 - IQ Scores. In Exercises 912, find the indicated IQ...Ch. 6.2 - IQ Scores. In Exercises 912, find the indicated IQ...Ch. 6.2 - Seat Designs. In Exercises 1320, use the data in...Ch. 6.2 - Seat Designs. In Exercises 1320, use the data in...Ch. 6.2 - Seat Designs. In Exercises 1320, use the data in...Ch. 6.2 - Seat Designs. In Exercises 1320, use the data in...Ch. 6.2 - Seat Designs. In Exercises 1320, use the data in...Ch. 6.2 - Seat Designs. In Exercises 1320, use the data in...Ch. 6.2 - Seat Designs. In Exercises 1320, use the data in...Ch. 6.2 - Seat Designs. In Exercises 1320, use the data in...Ch. 6.2 - In Exercises 2124, use these parameters (based on...Ch. 6.2 - In Exercises 2124, use these parameters (based on...Ch. 6.2 - In Exercises 2124, use these parameters (based on...Ch. 6.2 - In Exercises 2124, use these parameters (based on...Ch. 6.2 - Eye Contact In a study of facial behavior, people...Ch. 6.2 - Designing a Work Station A common design...Ch. 6.2 - Jet Ejection Seats The U.S. Air Force once used...Ch. 6.2 - Quarters After 1964, quarters were manufactured so...Ch. 6.2 - Low Birth Weight The University of Maryland...Ch. 6.2 - Body Temperatures Based on the sample results in...Ch. 6.2 - Durations of Pregnancies The lengths of...Ch. 6.2 - Water Taxi Safety When a water taxi sank in...Ch. 6.2 - Curving Test Scores A professor gives a test and...Ch. 6.2 - Outliers For the purposes of constructing modified...Ch. 6.3 - Births There are about 11,000 births each day in...Ch. 6.3 - Sampling with Replacement The Orangetown Medical...Ch. 6.3 - Unbiased Estimators Data Set 4 Births in Appendix...Ch. 6.3 - Sampling Distribution Data Set 4 Births in...Ch. 6.3 - Good Sample? A geneticist is investigating the...Ch. 6.3 - College Presidents There are about 4200 college...Ch. 6.3 - In Exercises 710, use the same population of {4,...Ch. 6.3 - In Exercises 710, use the same population of {4,...Ch. 6.3 - In Exercises 710, use the same population of {4,...Ch. 6.3 - In Exercises 710, use the same population of {4,...Ch. 6.3 - In Exercises 1114, use the population of {34, 36,...Ch. 6.3 - In Exercises 1114, use the population of {34, 36,...Ch. 6.3 - In Exercises 1114, use the population of {34, 36,...Ch. 6.3 - In Exercises 1114, use the population of {34, 36,...Ch. 6.3 - Births: Sampling Distribution of Sample Proportion...Ch. 6.3 - Births: Sampling Distribution of Sample Proportion...Ch. 6.3 - SAT and ACT Tests Because they enable efficient...Ch. 6.3 - Hybridization A hybridization experiment begins...Ch. 6.3 - Using a Formula to Describe a Sampling...Ch. 6.3 - Mean Absolute Deviation Is the mean absolute...Ch. 6.4 - Requirements A researcher collects a simple random...Ch. 6.4 - Small Sample Weights of golden retriever dogs are...Ch. 6.4 - Notation In general, what do the symbols x and x...Ch. 6.4 - Annual Incomes Annual incomes are known to have a...Ch. 6.4 - Using the Central Limit Theorem. In Exercises 58,...Ch. 6.4 - Using the Central Limit Theorem. In Exercises 58,...Ch. 6.4 - Using the Central Limit Theorem. In Exercises 58,...Ch. 6.4 - Using the Central Limit Theorem. In Exercises 58,...Ch. 6.4 - Elevator Safety Example 2 referred to an elevator...Ch. 6.4 - Elevator Safety Exercise 9 uses = 189 lb, which...Ch. 6.4 - Mensa Membership in Mensa requires a score in the...Ch. 6.4 - Designing Manholes According to the website...Ch. 6.4 - Water Taxi Safety Passengers died when a water...Ch. 6.4 - Vending Machines Quarters are now manufactured so...Ch. 6.4 - Southwest Airlines Seats Southwest Airlines...Ch. 6.4 - Coke Cans Assume that cans of Coke are filled so...Ch. 6.4 - Redesign of Ejection Seats When women were finally...Ch. 6.4 - Loading a Tour Boat The Ethan Allen tour boat...Ch. 6.4 - Doorway Height The Boeing 757-200 ER airliner...Ch. 6.4 - Loading Aircraft Before every flight, the pilot...Ch. 6.4 - Correcting for a Finite Population In a study of...Ch. 6.5 - Normal Quantile Plot Data Set 1 Body Data in...Ch. 6.5 - Normal Quantile Plot After constructing a...Ch. 6.5 - Small Sample Data set 29 Coin Weights in Appendix...Ch. 6.5 - Assessing Normality The accompanying histogram is...Ch. 6.5 - Prob. 5BSCCh. 6.5 - Prob. 6BSCCh. 6.5 - Prob. 7BSCCh. 6.5 - Interpreting Normal Quantile Plots. In Exercises...Ch. 6.5 - Prob. 9BSCCh. 6.5 - Constructing Normal Quantile Plots. In Exercises...Ch. 6.5 - Prob. 18BSCCh. 6.5 - Constructing Normal Quantile Plots. In Exercises...Ch. 6.5 - Constructing Normal Quantile Plots. In Exercises...Ch. 6.5 - Transformations The heights (in inches) of men...Ch. 6.5 - Lognormal Distribution The following are the...Ch. 6.6 - Continuity Correction In testing the assumption...Ch. 6.6 - Checking Requirements Common tests such as the...Ch. 6.6 - Notation Common tests such as the SAT, ACT, LSAT,...Ch. 6.6 - Distribution of Proportions Each week, Nielsen...Ch. 6.6 - Using Normal Approximation. In Exercises 58, do...Ch. 6.6 - Using Normal Approximation. In Exercises 58, do...Ch. 6.6 - Using Normal Approximation. In Exercises 58, do...Ch. 6.6 - Using Normal Approximation. In Exercises 58, do...Ch. 6.6 - Car Colors. In Exercises 912, assume that 100 cars...Ch. 6.6 - Car Colors. In Exercises 912, assume that 100 cars...Ch. 6.6 - Car Colors. In Exercises 912, assume that 100 cars...Ch. 6.6 - Car Colors. In Exercises 912, assume that 100 cars...Ch. 6.6 - Tennis Replay In the year that this exercise was...Ch. 6.6 - Tennis Replay Repeat the preceding exercise after...Ch. 6.6 - Smartphones Based on an LG smartphone survey,...Ch. 6.6 - Eye Color Based on a study by Dr. P. Sorita at...Ch. 6.6 - Mendelian Genetics When Mendel conducted his...Ch. 6.6 - Sleepwalking Assume that 29.2% of people have...Ch. 6.6 - Voters Lying? In a survey of 1002 people, 701 said...Ch. 6.6 - Cell Phones and Brain Cancer In a study of 420,095...Ch. 6.6 - Births The probability of a baby being born a boy...Ch. 6.6 - Overbooking a Boeing 767-300 A Boeing 767-300...Ch. 6 - Bone Density Test. In Exercises 14, assume that...Ch. 6 - Bone Density Test. In Exercises 14, assume that...Ch. 6 - Bone Density Test. In Exercises 14, assume that...Ch. 6 - Bone Density Test. In Exercises 14, assume that...Ch. 6 - Notation a. Identify the values of and for the...Ch. 6 - In Exercises 610, assume that women have diastolic...Ch. 6 - In Exercises 610, assume that women have diastolic...Ch. 6 - In Exercises 610, assume that women have diastolic...Ch. 6 - In Exercises 610, assume that women have diastolic...Ch. 6 - In Exercises 610, assume that women have diastolic...Ch. 6 - Bone Density Test A bone mineral density test is...Ch. 6 - Biometric Security In designing a security system...Ch. 6 - Biometric Security Standing eye heights of men are...Ch. 6 - Sampling Distributions Scores on the Gilliam...Ch. 6 - Unbiased Estimators a. What is an unbiased...Ch. 6 - Disney Monorail The Mark VI monorail used at...Ch. 6 - Disney Monorail Consider the same Mark VI monorail...Ch. 6 - Assessing Normality Listed below are the recent...Ch. 6 - Hybridization Experiment In one of Mendels...Ch. 6 - Tall Clubs The social organization Tall Clubs...Ch. 6 - In Exercises 13, use the following recent annual...Ch. 6 - In Exercises 13, use the following recent annual...Ch. 6 - In Exercises 13, use the following recent annual...Ch. 6 - Blue Eyes Assume that 35% of us have blue eyes...Ch. 6 - Foot Lengths of Women Assume that foot lengths of...Ch. 6 - Assessing Normality It is often necessary to...
Additional Math Textbook Solutions
Find more solutions based on key concepts
Find how many SDs above the mean price would be predicted to cost.
Intro Stats, Books a la Carte Edition (5th Edition)
In hypothesis testing, the common level of significance is =0.05. Some might argue for a level of significance ...
Basic Business Statistics, Student Value Edition
Women’s Heights Assume that college women’s heights are approximately Normally distributed with a mean of 65 in...
Introductory Statistics (2nd Edition)
An investment analyst has tracked a certain blue-chip stock for the past six months and found that on any given...
An Introduction to Mathematical Statistics and Its Applications (6th Edition)
Knowledge Booster


Learn more about
Need a deep-dive on the concept behind this application? Look no further. Learn more about this topic, statistics and related others by exploring similar questions and additional content below.Similar questions
- IQ Scores. In Exercises,find the area of the shaded region. The graphs depict IQ scores of adults, and those scores are normally distributed with a mean of 100 and a standard deviation of 15 (as on the Wechsler test).arrow_forwardEyeglassomatic manufactures eyeglasses for different retailers. They test to see how many defective lenses they made the time period of January 1 to March 31. The table gives the defect and the number of defects. Do the data support the notion that each defect type occurs in the same proportion? Test at the 5% level. Number of Defective Lenses Defect type Number of defects Scratch 1866 Right shaped - small 1935 Flaked 1979 Wrong axis 1921 Chamfer wrong 1864 Crazing, cracks 1991 Wrong shape 2004 Wrong PD 1895 Spots and bubbles 1917 Wrong height 1885 Right shape - big 1875 Lost in lab 1886 Spots/bubble - intern 1935 State the hypotheses.H0: Each defect type in the same proportion.Ha: Each defect type in the same proportion. Calculate the χ2 test statistic. Round expected values to two decimal places. Round χ2 to three decimal places.χ2 = Calculate the p-value. Round to four decimal places.p-value = State your decision.Since p-value 0.05,…arrow_forwardIQ Scores. In Exercises, find the area of the shaded region. The graphs depict IQ scores of adults, and those scores are normally distributed with a mean of 100 and a standard deviation of 15 (as on the Wechsler test).arrow_forward
- The table below shows the frequency distribution of the rainfall on 52 consecutive Wednesdays in a certain city. use the frequency distribution to construct a histogram. Do data appear to have a distribution that is approximately normal?arrow_forwarda. Which data set has a larger variation? (justify your answer)b. Is Chebyshev' rule verified for these two data sets. (Justify your answer graphically).c. What can we conclude?arrow_forwardRefer to the figure at the right. At a = 0.10, can you reject the claim that the proportion of 18 to 24-year-olds living in their parents' homes in 2000 was the same for men and women? Assume the survey included a random sample of 270 men and 278 women. Percentage of 18- to 24-year olds living in parents' homes 70,60.4% 54.6% 50.3% 45% 2000 2012 I Men IWomen Identify the null and alternative hypotheses. Choose the correct answer below. O B. Ho: P1 + P2 A. Ho: P1= P2 Hg: P1 P2 H: P1 =P2 OD. Ho: P,> P2 OC. Ho: P1 P2 Hg: P, SP2 Find the critical value(s). The critical value(s) is(are) +1.65. (Round to two decimal places as needed. Use a comma to separate answers as needed.) Find the standardized test statistic. z= 3.61 (Round to two decimal places as needed.) Can you reject the claim that the proportion of 18 to 24-year-olds living in their parents' homes was the same for men and women in 2000? . at the 10% significance level, there is v evidence to v the claim.arrow_forward
- The following histogram shows the scores on the first statistics exam. 25 21 20 15 10 i How many students took the exam? ii What is the class interval? iii What is the class midpoint for the first class? iv How many students earned a score of less than 70? State the level of measurement. Frequency 14 12 6 5- 3 0 50 60 70 80 90 100 Scorearrow_forwardphoto includedarrow_forwardRefer to the figure at the right. At a =0.10, can you reject the claim that the proportion of 18 to 24-year-olds living in their parents' homes in 2000 was the same for men and women? Assume the survey included a random sample of 248 men and 244 women. Percentage of 18- to 24-year olds iving in parents' homes 7051.5% 41.2% 46.6% 44.3% 2000 2012 I Men I Women Identify the null and alternative hypotheses. Choose the correct answer below. O B. Ho: P1 P2 O D. Ho: P, > P2 Cc. Họ: P1 = P2 Ha: P, SP2 H3: P, *P2 Find the critical value(s). The critical value(s) is(are) +1.65. (Round to two decimal places as needed. Use a comma to separate answers as needed.) Find the standardized test statistic. z= 2.29 (Round to two decimal places as needed.) Can you reject the claim that the proportion of 18 to 24-year-olds living in their parents' homes was the same for men and women in 2000? Yes , at the 10% significance level, there is sufficient evidence to support the claim.arrow_forward
- Provide an appropriate response.Find the area of the shaded region. The graph depicts IQ scores of adults, and those scores are normally distributed with a mean of 100 and a standard deviation of 18.arrow_forwardRefer to the figure at the right. At a =0.10, can you reject the claim that the proportion of 18 to 24-year-olds living in their parents' homes in 2000 was the same for men and women? Assume the survey included a random sample of 248 men and 244 women. Percentage of 18-to 24-year olds living in parents' homes 70- 51.5% 41.2% 46.6% 44.3% 0- 2012 I Women 2000 Men Identify the null and alternative hypotheses. Choose the correct answer below. O A. Ho: P1 #P2 Ha: P1 = P2 O B. Ho: P, P2 c. Họ: P1 = P2 Ha: P1 #P2 O D. Ho: P1 >P2 Ha: P1 SP2 Find the critical value(s). The critical value(s) is(are) ±1.65. (Round to two decimal places as needed. Use a comma to separate answers as needed.) Find the standardized test statistic. (Round to two decimal places as needed.)arrow_forwardPart B and C, please.arrow_forward
arrow_back_ios
SEE MORE QUESTIONS
arrow_forward_ios
Recommended textbooks for you
 Big Ideas Math A Bridge To Success Algebra 1: Stu...AlgebraISBN:9781680331141Author:HOUGHTON MIFFLIN HARCOURTPublisher:Houghton Mifflin Harcourt
 Glencoe Algebra 1, Student Edition, 9780079039897...AlgebraISBN:9780079039897Author:CarterPublisher:McGraw Hill
 Trigonometry (MindTap Course List)TrigonometryISBN:9781337278461Author:Ron LarsonPublisher:Cengage Learning
 Holt Mcdougal Larson Pre-algebra: Student Edition...AlgebraISBN:9780547587776Author:HOLT MCDOUGALPublisher:HOLT MCDOUGAL
Big Ideas Math A Bridge To Success Algebra 1: Stu...
Algebra
ISBN:9781680331141
Author:HOUGHTON MIFFLIN HARCOURT
Publisher:Houghton Mifflin Harcourt
Glencoe Algebra 1, Student Edition, 9780079039897...
Algebra
ISBN:9780079039897
Author:Carter
Publisher:McGraw Hill
Trigonometry (MindTap Course List)
Trigonometry
ISBN:9781337278461
Author:Ron Larson
Publisher:Cengage Learning
Holt Mcdougal Larson Pre-algebra: Student Edition...
Algebra
ISBN:9780547587776
Author:HOLT MCDOUGAL
Publisher:HOLT MCDOUGAL
Hypothesis Testing - Solving Problems With Proportions; Author: The Organic Chemistry Tutor;https://www.youtube.com/watch?v=76VruarGn2Q;License: Standard YouTube License, CC-BY
Hypothesis Testing and Confidence Intervals (FRM Part 1 – Book 2 – Chapter 5); Author: Analystprep;https://www.youtube.com/watch?v=vth3yZIUlGQ;License: Standard YouTube License, CC-BY