Foundations Of Finance
10th Edition
ISBN: 9780134897264
Author: KEOWN, Arthur J., Martin, John D., PETTY, J. William
Publisher: Pearson,
expand_more
expand_more
format_list_bulleted
Concept explainers
Videos
Textbook Question
Chapter 6, Problem 23SP
(Portfolio beta and security market line) You own a portfolio consisting of the stocks below:
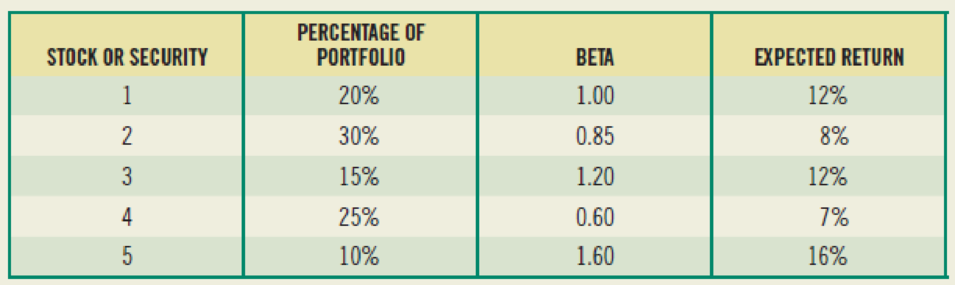
The risk-free rate is 3 percent. Also, the expected return on the market portfolio is 11 percent.
- a. Calculate the expected return of your portfolio. (Hint: The expected return of a portfolio equals the weighted average of the individual stocks’ expected returns, where the weights are the percentage invested in each stock.)
- b. Calculate the portfolio beta.
- c. Given the foregoing information, plot the security market line on paper. Plot the stocks from your portfolio on your graph.
- d. From your plot in part (c), which stocks appear to be your winners and which ones appear to be your losers?
- e. Why should you consider your conclusion in part (d) to be less than certain?
Expert Solution & Answer
Want to see the full answer?
Check out a sample textbook solution
Students have asked these similar questions
The risk-free rate is 3 percent. Also, the expected return on the market portfolio is 10.5 percent.a. Calculate the expected return of your portfolio. (Hint: The expected return of a portfolio equals the weighted average of the individual stocks" expected returns, where the weights are the percentage invested in each stock.)b. Calculate the portfolio beta.c. Given the preceding information, plot the security market line on paper. Plot the stocks from your portfolio on your graph.d. From your plot in part c, which stocks appear to be your winners, and which ones appear to be your losers?e. Why should you consider your conclusion in part d to be less than certain?
Consider a portfolio consisting of the following three stocks: The volatility of the market portfolio isCorrelation withPortfolio weight Volatility the Market PortfolioHEC Corp 0.26 13% 0.35Green Midget 0.29 28% 0.52Alive And Well 0.45 11% 0.5410% and it has an expected return of 8%. The risk-free rate is 3%.1. Compute the beta and expected return of each stock.2. Using your answer from question (1), calculate the expected return of the portfolio.3. What is the beta of the portfolio?
Suppose the expected return for the market portfolio and risk-free rate are 13 percent and 3 percent respectively. Stocks A, B, and C have Treynor measures of 0.24, 0.16, and 0.11, respectively. Based on this information, an investor should ______?
Chapter 6 Solutions
Foundations Of Finance
Ch. 6 - a. What is meant by the investors required rate of...Ch. 6 - Prob. 2RQCh. 6 - What is a beta? How is it used to calculate r, the...Ch. 6 - Prob. 4RQCh. 6 - Prob. 5RQCh. 6 - Prob. 6RQCh. 6 - Prob. 7RQCh. 6 - What effect will diversifying your portfolio have...Ch. 6 - (Expected return and risk) Universal Corporation...Ch. 6 - (Average expected return and risk) Given the...
Ch. 6 - (Expected rate of return and risk) Carter, Inc. is...Ch. 6 - (Expected rate of return and risk) Summerville,...Ch. 6 - Prob. 5SPCh. 6 - Prob. 9SPCh. 6 - Prob. 10SPCh. 6 - Prob. 11SPCh. 6 - Prob. 12SPCh. 6 - Prob. 14SPCh. 6 - (Capital asset pricing model) Using the CAPM,...Ch. 6 - Prob. 16SPCh. 6 - Prob. 17SPCh. 6 - a. Compute an appropriate rate of return for Intel...Ch. 6 - (Estimating beta) From the graph in the right...Ch. 6 - Prob. 20SPCh. 6 - Prob. 21SPCh. 6 - (Capital asset pricing model) The expected return...Ch. 6 - (Portfolio beta and security market line) You own...Ch. 6 - (Portfolio beta) Assume you have the following...Ch. 6 - Prob. 1MCCh. 6 - Prob. 2MCCh. 6 - Prob. 3MCCh. 6 - Prob. 4MCCh. 6 - Prob. 5MCCh. 6 - Prob. 6MCCh. 6 - Prob. 7MCCh. 6 - Prob. 8MCCh. 6 - Prob. 9MCCh. 6 - Prob. 10MCCh. 6 - Prob. 11MC
Knowledge Booster


Learn more about
Need a deep-dive on the concept behind this application? Look no further. Learn more about this topic, finance and related others by exploring similar questions and additional content below.Similar questions
- You have observed the following returns over time: Assume that the risk-free rate is 6% and the market risk premium is 5%. What are the betas of Stocks X and Y? What are the required rates of return on Stocks X and Y? What is the required rate of return on a portfolio consisting of 80% of Stock X and 20% of Stock Y?arrow_forwardAn analyst has modeled the stock of a company using the Fama-French three-factor model. The market return is 10%, the return on the SMB portfolio (rSMB) is 3.2%, and the return on the HML portfolio (rHML) is 4.8%. If ai = 0, bi = 1.2, ci = 20.4, and di = 1.3, what is the stock’s predicted return?arrow_forwardTwo-Asset Portfolio Stock A has an expected return of 12% and a standard deviation of 40%. Stock B has an expected return of 18% and a standard deviation of 60%. The correlation coefficient between Stocks A and B is 0.2. What are the expected return and standard deviation of a portfolio invested 30% in Stock A and 70% in Stock B?arrow_forward
- Consider a portfolio consisting of the three risky stocks. You decide to invest 25 percent in Apple, 35 percent in HP and 40 percent in Spree. These stocks show the volatility at the level of 11.15 percent, 24.4 percent and 15.29 percent, and the correlation with the market portfolio at the level of 0.65, 0.83 and 0.36, respectively. Calculate the expected portfolio return using CAPM if the market portfolio shows the expected return of 12.88 percent and its volatility is 10.05 percent. The risk-free rate of return is 3.31 percent. Please make sure your answer is correct tutor. Out of my questions in Bartleby, 90% are wrong all the time. Which is resulting also to my low grades. Don't get it if you don't know the answer. Please use TEXT. not snip or handwriting. Thank youarrow_forwardA portfolio consists of Stock X and Stock Y. Data for the 2 stocks is shown below. Calculate the expected return of the portfolio Calculate the standard deviation of the portfolio. Calculate the beta of the portfolio Is your portfolio less risky or more risky than the market? Explain. Will your portfolio likely outperform or underperform the market in a period when stocks are rapidly falling in value? Why? STOCK X EXPECTED RETUR 10% STOCK X STANDARD DEVIATION 30% STOCK Y EXPECTED RETURN 14% STOCK Y STANDARD DEVIATION 40% CORRELATION BETWEEN X AND Y 0.30 STOCK X BETA 0.90 STOCK Y BETA 0.85 %PORTFOLIO IN X 40% %PORTFOLIO Y 60%arrow_forwardUsing the data in the following table, LOADING... , consider a portfolio that maintains a 75% weight on stock A and a 25% weight on stock B. a. What is the return each year of this portfolio? b. Based on your results from part (a), compute the average return and volatility of the portfolio. c. Show that (i) the average return of the portfolio is equal to the (weighted) average of the average returns of the two stocks, and (ii) the volatility of the portfolio equals the same result as from the calculation in Eq. 11.9. d. Explain why the portfolio has a lower volatility than the average volatility of the two stocks. Question content area bottom Part 1 a. What is the return each year of this portfolio? Enter the return of this portfolio for each year in the table below: (Round to two decimal places.) Year 2010 2011 2012 2013 2014 2015 Portfolio enter your response here% enter your response here% enter your response…arrow_forward
arrow_back_ios
arrow_forward_ios
Recommended textbooks for you
 EBK CONTEMPORARY FINANCIAL MANAGEMENTFinanceISBN:9781337514835Author:MOYERPublisher:CENGAGE LEARNING - CONSIGNMENT
 Intermediate Financial Management (MindTap Course...FinanceISBN:9781337395083Author:Eugene F. Brigham, Phillip R. DavesPublisher:Cengage Learning

EBK CONTEMPORARY FINANCIAL MANAGEMENT
Finance
ISBN:9781337514835
Author:MOYER
Publisher:CENGAGE LEARNING - CONSIGNMENT
Intermediate Financial Management (MindTap Course...
Finance
ISBN:9781337395083
Author:Eugene F. Brigham, Phillip R. Daves
Publisher:Cengage Learning
Portfolio return, variance, standard deviation; Author: MyFinanceTeacher;https://www.youtube.com/watch?v=RWT0kx36vZE;License: Standard YouTube License, CC-BY