Intro Stats + MyStatLab Access Code
4th Edition
ISBN: 9780321891242
Author: De Veaux, Richard
Publisher: Pearson College Div
expand_more
expand_more
format_list_bulleted
Concept explainers
Videos
Textbook Question
Chapter 6, Problem 26E
Traffic headaches A study of traffic delays in 68 U.S. cities found the following relationship between Total Delay (in total hours lost) and Mean Highway Speed:
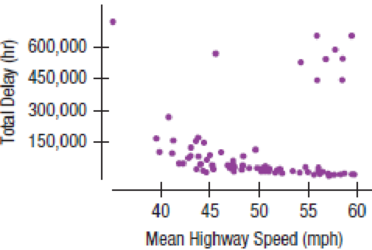
Is it appropriate to summarize the strength of association with a
Expert Solution & Answer
Want to see the full answer?
Check out a sample textbook solution
Chapter 6 Solutions
Intro Stats + MyStatLab Access Code
Ch. 6.2 - Your statistics instructor tells you that the...Ch. 6.2 - Your statistics instructor tells you that the...Ch. 6.2 - Your statistics instructor tells you that the...Ch. 6.2 - Prob. 4JCCh. 6.2 - Prob. 5JCCh. 6 - Association Suppose you were to collect data for...Ch. 6 - Association II Suppose you were to collect data...Ch. 6 - Bookstore sales Consider the following data from a...Ch. 6 - Prob. 4ECh. 6 - Prob. 5E
Ch. 6 - Correlation facts II If we assume that the...Ch. 6 - Prob. 7ECh. 6 - Prob. 8ECh. 6 - Prob. 9ECh. 6 - Prob. 10ECh. 6 - Association III Suppose you were to collect data...Ch. 6 - Prob. 12ECh. 6 - Prob. 13ECh. 6 - Prob. 14ECh. 6 - Prob. 15ECh. 6 - Prob. 16ECh. 6 - Firing pottery A ceramics factory can fire eight...Ch. 6 - Coffee sales Owners of a new coffee shop tracked...Ch. 6 - Matching Here are several scatterplots. The...Ch. 6 - Matching II Here are several scatterplots. The...Ch. 6 - Prob. 21ECh. 6 - Car thefts The National Insurance Crime Bureau...Ch. 6 - Prob. 23ECh. 6 - Antidepressants A study compared the effectiveness...Ch. 6 - Streams and hard water In a study of streams in...Ch. 6 - Traffic headaches A study of traffic delays in 68...Ch. 6 - Cold nights Is there an association between time...Ch. 6 - Association V A researcher investigating the...Ch. 6 - Prob. 29ECh. 6 - Prob. 30ECh. 6 - Correlation errors Your Economics instructor...Ch. 6 - More correlation errors Students in the Economics...Ch. 6 - Height and reading A researcher studies children...Ch. 6 - Prob. 34ECh. 6 - Correlation conclusions I The correlation between...Ch. 6 - Prob. 36ECh. 6 - Prob. 37ECh. 6 - Sample survey A polling organization is checking...Ch. 6 - Income and housing The Office of Federal Housing...Ch. 6 - Prob. 40ECh. 6 - 41. Fuel economy 2010 Here are advertised...Ch. 6 - Drug abuse A survey was conducted in the United...Ch. 6 - Prob. 43ECh. 6 - Burgers again In the previous exercise you...Ch. 6 - Prob. 45ECh. 6 - 46. Second inning 2010 Perhaps fans are just more...Ch. 6 - Prob. 47ECh. 6 - Prob. 48ECh. 6 - Prob. 49ECh. 6 - Vehicle weights The Minnesota Department of...Ch. 6 - Prob. 51ECh. 6 - Prob. 52E
Additional Math Textbook Solutions
Find more solutions based on key concepts
Ten equally qualified marketing assistants are candidates for promotion to associate buyer; seven are men and t...
An Introduction to Mathematical Statistics and Its Applications (6th Edition)
31. Putting It Together: A Tornado Model Is the width of a tornado related to the amount of distance for which ...
Statistics: Informed Decisions Using Data (5th Edition)
2.18 Graph the relative frequency histogram for the 500 measurements summarized in the accompanying relative fr...
Statistics for Business and Economics (13th Edition)
Knowledge Booster


Learn more about
Need a deep-dive on the concept behind this application? Look no further. Learn more about this topic, statistics and related others by exploring similar questions and additional content below.Recommended textbooks for you
 Glencoe Algebra 1, Student Edition, 9780079039897...AlgebraISBN:9780079039897Author:CarterPublisher:McGraw Hill
 Algebra and Trigonometry (MindTap Course List)AlgebraISBN:9781305071742Author:James Stewart, Lothar Redlin, Saleem WatsonPublisher:Cengage Learning
 Big Ideas Math A Bridge To Success Algebra 1: Stu...AlgebraISBN:9781680331141Author:HOUGHTON MIFFLIN HARCOURTPublisher:Houghton Mifflin Harcourt
Glencoe Algebra 1, Student Edition, 9780079039897...
Algebra
ISBN:9780079039897
Author:Carter
Publisher:McGraw Hill
Algebra and Trigonometry (MindTap Course List)
Algebra
ISBN:9781305071742
Author:James Stewart, Lothar Redlin, Saleem Watson
Publisher:Cengage Learning
Big Ideas Math A Bridge To Success Algebra 1: Stu...
Algebra
ISBN:9781680331141
Author:HOUGHTON MIFFLIN HARCOURT
Publisher:Houghton Mifflin Harcourt
Correlation Vs Regression: Difference Between them with definition & Comparison Chart; Author: Key Differences;https://www.youtube.com/watch?v=Ou2QGSJVd0U;License: Standard YouTube License, CC-BY
Correlation and Regression: Concepts with Illustrative examples; Author: LEARN & APPLY : Lean and Six Sigma;https://www.youtube.com/watch?v=xTpHD5WLuoA;License: Standard YouTube License, CC-BY