
Concept explainers
Videos
a)
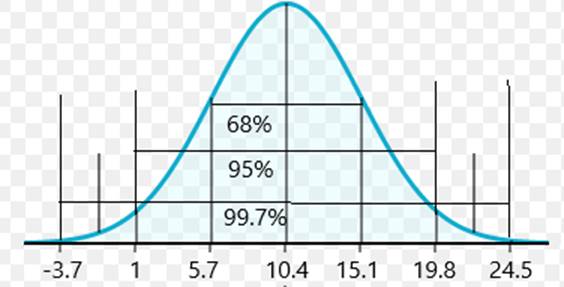
To draw the model which shows 68-95-99.7
a)
Explanation of Solution
Given:
Following is the model which shows 68-95-99.7:
b)
To explain what size to be expected that central 95% of all trees.
b)
Answer to Problem 29E
An interval in which central 95% of trees to be found between 1 and 19.8
Explanation of Solution
Given:
According to rule of 68-95-99.7, the 95% of the values are within 2 standard deviation of the mean.
Therefore,
Hence, interval in which central 95% of trees to be found between 1 and 19.8
c)
To find the percentage of trees that should be less than 1 inch in diameter.
c)
Answer to Problem 29E
The 2.5% of the trees are less than an inch in diameter.
Explanation of Solution
Given:
According to rule of 68-95-99.7, the 95% of the values are within 2 standard deviation of the mean.
Therefore,
That means, 1 inch is two standard deviations from the mean. According to rule, 95% of the data lies between 2 standard deviations from the mean. Since, total data is 100%, so 5% of the data is the more than 2 standard deviations from the mean. Therefore, as per symmetry, 2.5% is more than 2 standard deviations below the mean and 2.5% is more than 2 standard deviations above the mean.
Hence, approximately 2.5% of the trees are less than an inch in diameter.
d)
To find the percentage of trees that should be between 5.7 and 10.4 in diameter.
d)
Answer to Problem 29E
The 32% of the trees are between 5.7 and 10.4 an inch in diameter.
Explanation of Solution
Given:
According to rule of 68-95-99.7, the 68% of the values are within 1 standard deviation of the mean.
Therefore,
That means, 5.7 is one standard deviation below the mean.
Therefore, 100%-68% = 32% which is more than mean and less than 1 standard deviation of the mean. Therefore, 32% of the data lie between 5.7 and 10.4
e)
To find the percentage of trees that should be over 15 in diameter.
e)
Answer to Problem 29E
The 2.5% of the trees should over 15 inches in diameter.
Explanation of Solution
Given:
According to rule of 68-95-99.7, 15 is 2 standard deviation from the mean.
According to rule, 95% of the data lies between 2 standard deviations from the mean. Since, total data is 100%, so 5% of the data is the more than 2 standard deviations from the mean. Therefore, as per symmetry, 2.5% is more than 2 standard deviations below the mean and 2.5% is more than 2 standard deviations above the mean.
Hence, 2.5% of the trees should over 15 inches in diameter.
Chapter 6 Solutions
Stats: Modeling the World Nasta Edition Grades 9-12
Additional Math Textbook Solutions
Introductory Statistics (2nd Edition)
Introductory Statistics (10th Edition)
Statistics: The Art and Science of Learning from Data (4th Edition)
Statistics for Business and Economics (13th Edition)
Statistical Reasoning for Everyday Life (5th Edition)
Essentials of Statistics, Books a la Carte Edition (5th Edition)


 MATLAB: An Introduction with ApplicationsStatisticsISBN:9781119256830Author:Amos GilatPublisher:John Wiley & Sons Inc
 Probability and Statistics for Engineering and th...StatisticsISBN:9781305251809Author:Jay L. DevorePublisher:Cengage Learning
 Statistics for The Behavioral Sciences (MindTap C...StatisticsISBN:9781305504912Author:Frederick J Gravetter, Larry B. WallnauPublisher:Cengage Learning
 Elementary Statistics: Picturing the World (7th E...StatisticsISBN:9780134683416Author:Ron Larson, Betsy FarberPublisher:PEARSON
 The Basic Practice of StatisticsStatisticsISBN:9781319042578Author:David S. Moore, William I. Notz, Michael A. FlignerPublisher:W. H. Freeman
 Introduction to the Practice of StatisticsStatisticsISBN:9781319013387Author:David S. Moore, George P. McCabe, Bruce A. CraigPublisher:W. H. Freeman