
a.
To find: The probability
a.
Answer to Problem 6.1.3RE
The probability using the standard normal distribution is
Explanation of Solution
Given info:
The z values are 0 and 2.07.
Calculation:
Software procedure:
Step by step procedure to find the area under the normal curve between 0 and 2.06with the help of following instructions:
- Select Graph > Probability Distribution Plot > View Probability >OK.
- From Distribution, choose ‘Normal’ distribution.
- Enter the Mean as 0.0 and Standard deviation as 1.0.
- Choose the tab for Shaded Area, then X Value.
- Click the picture for Middle.
- Type in the smaller value 0 for X value1 and then the larger value 2.07 for the X value2.
- Click OK.
Output using the MINITAB software is given below:
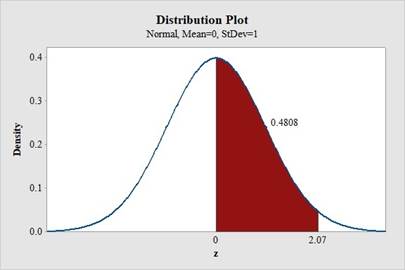
Therefore,
Conclusion:
The probability using the standard normal distribution is
b.
To find: The probability
b.
Answer to Problem 6.1.3RE
The probability using the standard normal distribution is
Explanation of Solution
Given info:
The z values are -1.83 and 0.
Calculation:
Software procedure:
Step by step procedure to find the area under the normal curve between 0 and 0.37 with the help of following instructions:
- Select Graph > Probability Distribution Plot > View Probability >OK.
- From Distribution, choose ‘Normal’ distribution.
- Enter the Mean as 0.0 and Standard deviation as 1.0.
- Choose the tab for Shaded Area, then X Value.
- Click the picture for Middle.
- Type in the smaller value -1.83 for X value1 and then the larger value 0 for the X value2.
- Click OK.
Output using the MINITAB software is given below:
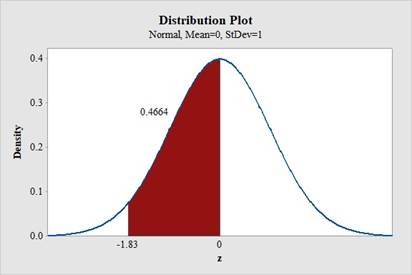
Therefore,
Conclusion:
The probability using the standard normal distribution is
c.
To find: The probability
c.
Answer to Problem 6.1.3RE
The probability using the standard normal distribution is
Explanation of Solution
Given info:
The z values are -1.59 and 2.01.
Calculation:
Software procedure:
Step by step procedure to find the area under the normal curve between -1.59 and 2.01with the help of following instructions:
- Select Graph > Probability Distribution Plot > View Probability >OK.
- From Distribution, choose ‘Normal’ distribution.
- Enter the Mean as 0.0 and Standard deviation as 1.0.
- Choose the tab for Shaded Area, then X Value.
- Click the picture for Middle.
- Type in the smaller value -1.59 for X value1 and then the larger value 2.01 for the X value2.
- Click OK.
Output using the MINITAB software is given below:
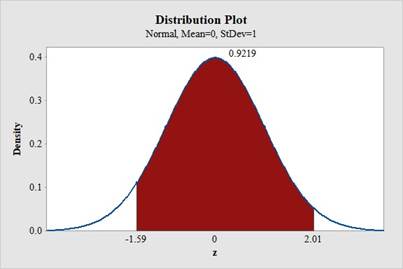
Therefore,
Conclusion:
The probability using the standard normal distribution is
d.
To find: The probability
d.
Answer to Problem 6.1.3RE
The probability using the standard normal distribution is
Explanation of Solution
Given info:
The z values are 1.33 and 1.88.
Calculation:
Software procedure:
Step by step procedure to; find the area under the normal curve between 1.33 and 1.88with the help of following instructions:
- Select Graph > Probability Distribution Plot > View Probability >OK.
- From Distribution, choose ‘Normal’ distribution.
- Enter the Mean as 0.0 and Standard deviation as 1.0.
- Choose the tab for Shaded Area, then X Value.
- Click the picture for Middle.
- Type in the smaller value 1.33 for X value1 and then the larger value 1.88 for the X value2.
- Click OK.
Output using the MINITAB software is given below:
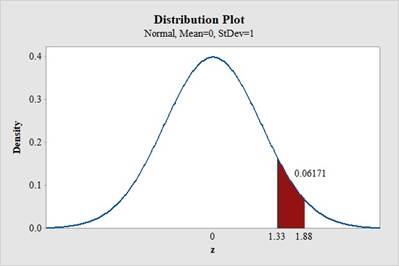
Therefore,
Conclusion:
The probability using the standard normal distribution is
e.
To find: The probability
e.
Answer to Problem 6.1.3RE
The probability using the standard normal distribution is
Explanation of Solution
Given info:
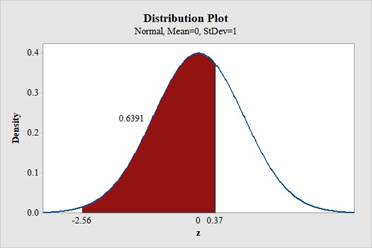
The z values are -2.56 and 0.37.
Calculation:
Software procedure:
Step by step procedure to; find the area under the normal curve between -2.56 and 0.37 with the help of following instructions:
- Select Graph > Probability Distribution Plot > View Probability >OK.
- From Distribution, choose ‘Normal’ distribution.
- Enter the Mean as 0.0 and Standard deviation as 1.0.
- Choose the tab for Shaded Area, then X Value.
- Click the picture for Middle.
- Type in the smaller value −2.56 for X value1 and then the larger value 0.37 for the X value2.
- Click OK.
Output using the MINITAB software is given below:
Therefore,
Conclusion:
The probability using the standard normal distribution is
Want to see more full solutions like this?
Chapter 6 Solutions
Loose Leaf Elementary Statistics: A Step By Step Approach With Formula Card And Connect Hosted By Aleks Access Card

 MATLAB: An Introduction with ApplicationsStatisticsISBN:9781119256830Author:Amos GilatPublisher:John Wiley & Sons Inc
 Probability and Statistics for Engineering and th...StatisticsISBN:9781305251809Author:Jay L. DevorePublisher:Cengage Learning
 Statistics for The Behavioral Sciences (MindTap C...StatisticsISBN:9781305504912Author:Frederick J Gravetter, Larry B. WallnauPublisher:Cengage Learning
 Elementary Statistics: Picturing the World (7th E...StatisticsISBN:9780134683416Author:Ron Larson, Betsy FarberPublisher:PEARSON
 The Basic Practice of StatisticsStatisticsISBN:9781319042578Author:David S. Moore, William I. Notz, Michael A. FlignerPublisher:W. H. Freeman
 Introduction to the Practice of StatisticsStatisticsISBN:9781319013387Author:David S. Moore, George P. McCabe, Bruce A. CraigPublisher:W. H. Freeman