Concept explainers
Videos
Students in the materials class prepared three mortar mixes with water to cement ratios of 0.50, 0.55, and 0.60. Three 2-in. mortar cubes were prepared for each mix. The cubes were cured for 7 days and then tested for compressive strength. The test results were as shown in Table P6.17.
Determine the following:
a. The compressive strength of each cube.
b. The average compressive strength for each mix.
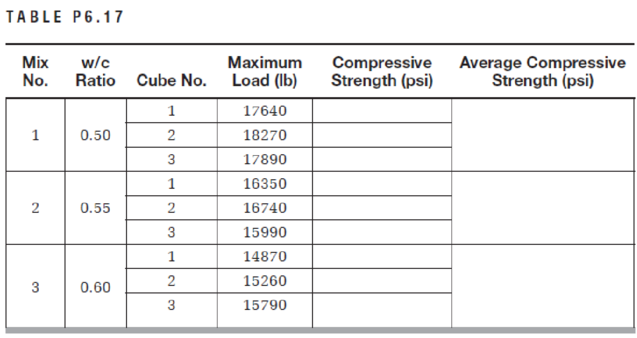
c. Plot the average compressive strength versus w/c ratios for all mixes.
d. Comment on the effect of increasing w/c ratio on the compressive strength of the cubes.

Learn your wayIncludes step-by-step video

Chapter 6 Solutions
Pearson eText for Materials for Civil and Construction Engineers -- Instant Access (Pearson+)
Additional Engineering Textbook Solutions
Foundation Design: Principles and Practices (3rd Edition)
Starting Out with Java: Early Objects (6th Edition)
C++ How to Program (10th Edition)
Computer Science: An Overview (12th Edition)
Computer Systems: A Programmer's Perspective (3rd Edition)
Concepts of Programming Languages (11th Edition)


- Three mortar mixes were prepared with water to cement ratios of 0.50, 0.55, and 0.60. Three 2-in. mortar cubes were prepared for each mix. The cubes were cured for 7 days and then tested for compressive strength. The test results were as shown in Table.Determine the following:a. The compressive strength of each cube.b. The average compressive strength for each mix. c. Plot the average compressive strength versus w/c ratios for all mixes.d. Comment on the effect of increasing w/c ratio on the compressive strength of the cubes.arrow_forward2. In a ready-mix concrete plant, cylindrical samples are prepared and tested periodically to detect any mix problem and to ensure that the compressive strength is higher than the lower specification limit. The minimum target value was set at 5,000 psi. The following compressive strength data were collected. Sample No. 1 2 3 4 5 6 7 8 9 10 Compressive strength (psi) 5595 5139 6359 5192 5188 5241 5964 5875 6155 5115 Sample No. 11 12 13 14 15 16 17 18 19 20 Compressive strength (psi) 6695 5449 5278 6697 5195 6021 5320 5657 6595 5235 a. Calculate the mean, standard deviation, and the coefficient of variation of the data b. Using a spreadsheet program, create a control chart for these data showing the target value and the lower specification limit. Is the plant production meeting the specification requirement? If not, comment on possible reasons. Comment on the data scatter.arrow_forward3) Students in the materials lab mixed concrete with the following ingredients:9.7 kg of cement, 18.1 kg of sand, 28.2 kg of gravel, and 6.5 kg of water. The sand has a moisture content of 3.1% and an absorption of 4.2%. The gravel has a moisture content of 3.4% and an absorption of 4.4%. Since water absorbed in the aggregate does not react with the cement or improve the workability of the plastic concrete, what is the water–cement ratio of this mix according to the American Concrete Institute’s weight mix design method? If a water–cement ratio of 0.5 is required using the same materials and ingredients but different amount of mixing water, what is the weight of the mixing water to use?arrow_forward
- 6.31 The results of a laboratory experiment to evaluate the effects of a plasticizer are shown below. a. Calculate the water/cement in each of the three cases. b. Using water reducer, how can we increase the compressive strength of con- crete without changing workability? Refer to the appropriate case in the table. 244 Chapter 6 Portland Cement, Mixing Water, and Admixtures With Water Reducer Without Water Reducer Case 1 Case 2 Case 3 Cement Content, kg/m 850 850 850 765 Water Content, kg/m Slump, mm Compressive Strength, MPa 465 465 370 419 50 100 50 50 37.8 38.0 46 37.9 c. Using water reducer, how can we improve workability without channging the compressive strength? Refer to the appropriate case in the table. d. Using water reducer, how can we reduce cost without changing workability or strength? (Assume that the cost of the small amount of water reducer added is less than the cost of cement.) Refer to the appropriate case in the table. Summarize all possible effects of water…arrow_forwardFollowing is the given data of compressive strength test done on 2 inch cement mortar cubes: w/c Cube Maximum Load (lb) 17640 18270 17890 16350 16740 15990 14870 15260 15790 Ratio No. 0.50 0.55 2 0.60 Determine: a) Compressive strength of each cube. b) Average compressive strength for each mix. 312marrow_forwardThree concrete mixes with the same ingredients, except the amount of mixing water, and their slump values were obtained. Three 150 mm * 300 mm concrete cylinders were prepared for each mix. The cylinders were cured for 7 days and then tested for compressive strength. The test results are as shown. Assume that the aggregate was at the saturated surface-dry condition before adding mixing water.It is required to do the following:a. Determine the compressive strength of each cylinder after 7 days.b. Determine the average compressive strength of each mix after 7 days.c. Determine the w/c ratio for each mix.arrow_forward
- 1.40 In a ready-mix plant, cylindrical samples are prepared and tested periodically to detect any mix problem and to ensure that the compressive strength is higher than the lower specification limit. The minimum target value was set at 5,000 psi. The following compressive strength data were collected. Compressive Strength (psi) Compressive Strength (psi) Sample No. Sample No. 1 5595 11 6695 2 5139 12 5449 6359 13 5278 4 5192 14 6697 5 5188 15 5195 6. 5241 16 6021 7 5964 17 5320 5875 18 5657 6155 19 6595 10 5115 20 5235 a. Calculate the mean, standard deviation, and the coefficient of variation of the data. b. Using a spreadsheet program, create a control chart for these data showing the target value and the lower specification limit. Is the plant production meeting the specification requirement? If not, comment on possible rea- sons. Comment on the data scatter.arrow_forward3. A concrete mix includes the following ingredients per cubic foot: (14 pts.) = 25 lbs. = 11 lbs. Cement Water No Admixture Table shows possible changes that can be made to the mix ingredients. Indicate in the appropriate boxes in the table what will happen in each case for the workability and the ultimate compressive strength as increase, decrease, or approximately the same. What WIlII Happen? Ultimate Compressive Strength Cement (Ib) Water (Ib) Admixture Workablity None 25 28 15 11 None Water reducer Water reducer Superplasticizer Air entrainer Accelerator 25 11 25 8. 25 11 25 11 25 11arrow_forwardQ. Using the British methods, design a concrete mix to bear an average compressive strength of 35 MPa at 28 days, to cast a room slab with the following dimensions (5 width x 4 length x 0.2 depth m) and 200 mm space distance of reinforcement. Consider the following properties: o Cement used is type I Portland cement ® Required slump = 30 — 60 mm o Coarse aggregate: ® Crushed rocks * Maximum size of 40 mm, e The fine aggregate: * Crushed rocks = Falls in zone 3 o Assume zone A for figure 1 o AssumeK = 1.64arrow_forward
- Students in the materials lab mixed concrete with the following ingredients:9.7 kg of cement, 18.1 kg of sand, 28.2 kg of gravel, and 6.5 kg of water. The sand has a moisture content of 3.1% and an absorption of 4.2%. The gravel has a moisture content of 3.4% and an absorption of 4.4%. Since water absorbed in the aggregate does not react with the cement or improve the workability of the plastic concrete, what is the water–cement ratio of this mix according to the American Concrete Institute’s weight mix design method? If a water– cement ratio of 0.5 is required using the same materials and ingredients but different amount of mixing water, what is the mass of the mixing water to use?arrow_forwardThree mortar mixes were prepared with water to cement ratios of 0.50, 0.55, and 0.60. Three 2-in. mortar cubes were prepared for each mix. The cubes were cured for 7 days and then tested for compressive strength. The testresults were as shown in Table. Determine the following: a. The compressive strength of each cube. b. The average compressive strength for each mix. Mix No. w/c Ratio Cube No. Maximum Compressive Strength (psi) Average Compressive Strength (psi) Load (Ib) 17640 0.50 2 18270 3 17890 16350 2 0.55 16740 15990 14870 2 15260 0.60 15790 2. 3. 1.arrow_forwardDesign the concrete mix according to the following conditions: Design Environment Building frame Required design strength = 27.6 MPa Minimum dimension = 150 mm Minimum space between rebar = 40 mm Minimum cover over rebar = 40 mm Statistical data indicate a standard deviation of compressive strength of 2.1 MPa is expected (more than 30 samples). Only air entrainer is allowed. Available Materials Air entrainer: Manufacture specification 6.3 ml/1% air/100 kg cement. Coarse aggregate: 19 mm nominal maximum size, river gravel (rounded) Bulk oven-dry specific gravity = 2.55, Absorption = 0.3% Oven-dry rodded density = 1761 kg/m3 Moisture content = 2% Fineness modulus = 2.47arrow_forward

 Structural Analysis (10th Edition)Civil EngineeringISBN:9780134610672Author:Russell C. HibbelerPublisher:PEARSON
 Principles of Foundation Engineering (MindTap Cou...Civil EngineeringISBN:9781337705028Author:Braja M. Das, Nagaratnam SivakuganPublisher:Cengage Learning
 Fundamentals of Structural AnalysisCivil EngineeringISBN:9780073398006Author:Kenneth M. Leet Emeritus, Chia-Ming Uang, Joel LanningPublisher:McGraw-Hill Education
 Traffic and Highway EngineeringCivil EngineeringISBN:9781305156241Author:Garber, Nicholas J.Publisher:Cengage Learning