
Managerial Accounting (5th Edition)
5th Edition
ISBN: 9780134067254
Author: Braun
Publisher: PEARSON
expand_more
expand_more
format_list_bulleted
Videos
Textbook Question
Chapter 6, Problem 6.28AE
Regression analysis using Excel output (Learning Objective 5)
Assume that Broadway Floral does a regression analysis on the next year’s data using Excel. The output generated by Excel is as follows:
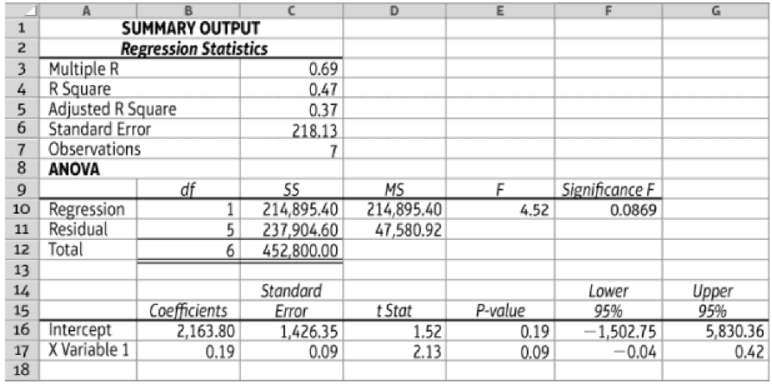
6.2-66 Full Alternative Text
Requirements
- 1. Determine the firm’s cost equation (use the output from the Excel regression).
- 2. Determine the R-square (use the output from the Excel regression). What does Broadway Floral’s R-square indicate?
- 3. Predict van operating costs at a volume of 16,000 miles assuming the company would use the cost equation from the Excel regression regardless of its R-square. Should the company rely on this cost estimate? Why or why not?
Expert Solution & Answer
Want to see the full answer?
Check out a sample textbook solution
Students have asked these similar questions
Can you show step-by-step working, using the Gordon Growth model for calculating the the answer for cheers and think local without using excel?
If an 80% learning curve is applicable, NUBD’s total cost on this order would be estimated at
A. P26,400
B. P37,950
C. P31,790
D. P38,500
E. P27,600
Learning Tasks
A. Discussion Questions:
1. Explain why a contribution margin per unit becomes profit per unit above the breakeven
point.
2. Suppose a firm with a contribution margin percentage of 30% increased its advertising
expenses by P10,000 and found that sales increased by P 30,000. Was it a good
decision to increase advertising expenses? Suppose that the contribution margin ratio is
now 40%. Would it be a good decision to increase advertising expense?
B. Fill in the blanks for each of the following independent cases.
Case
Revenues
Variable Cost
Fixed Cost
Total Costs
Operating
Contribution
Income
Margin
Percentage
A
P500
P-
P800
P1,200
2,000
1,000
В
300
200
C
700
1,000
---- ----
1,500
300
40%
Assessment Task
Chapter 6 Solutions
Managerial Accounting (5th Edition)
Ch. 6 - (Learning Objective 1) A graph of a variable cost...Ch. 6 - (Learning Objective 2) Which of the following is...Ch. 6 - (Learning Objective 2) In the cost equation...Ch. 6 - Prob. 4QCCh. 6 - Prob. 5QCCh. 6 - (Learning Objective 3) Which of the following is...Ch. 6 - Prob. 7QCCh. 6 - (Learning Objective 5) Which of the following is...Ch. 6 - Prob. 9QCCh. 6 - Prob. 10QC
Ch. 6 - Identify cost behavior (Learning Objectives 1 2)...Ch. 6 - Prob. 6.2SECh. 6 - Compute fixed costs per unit (Learning Objective...Ch. 6 - Prob. 6.4SECh. 6 - Predict and graph total mixed costs (Learning...Ch. 6 - Prob. 6.6SECh. 6 - Prepare and analyze a scatterplot (Learning...Ch. 6 - Prob. 6.8SECh. 6 - Use the high-low method (Learning Objective 4)...Ch. 6 - Prob. 6.10SECh. 6 - Prob. 6.11SECh. 6 - Prob. 6.12SECh. 6 - Write a cost equation given regression output...Ch. 6 - Prepare a contribution margin income statement...Ch. 6 - Prepare income statements using variable costing...Ch. 6 - Prepare income statements using variable costing...Ch. 6 - Identify cost behavior graph (Learning Objectives...Ch. 6 - Prob. 6.18SECh. 6 - Prob. 6.19SECh. 6 - Prob. 6.20AECh. 6 - Prepare income statement in two formats (Learning...Ch. 6 - Prob. 6.22AECh. 6 - Prob. 6.23AECh. 6 - Sustainability and cost estimation (Learning...Ch. 6 - Create a scatterplot (Learning Objective 3) Melody...Ch. 6 - Continuation of E6-25A: High-low method (Learning...Ch. 6 - Continuation of E6-25A: Regression analysis...Ch. 6 - Regression analysis using Excel output (Learning...Ch. 6 - Prob. 6.29AECh. 6 - Using the high-low method to predict overhead for...Ch. 6 - Using regression analysis output to predict...Ch. 6 - Performing a regression analysis to predict...Ch. 6 - Prob. 6.33AECh. 6 - Prob. 6.34AECh. 6 - Compare absorption and variable costing (Learning...Ch. 6 - Prepare a contribution margin income statement...Ch. 6 - Prepare a contribution margin income statement...Ch. 6 - Prepare income statements using variable costing...Ch. 6 - Prepare a variable costing income statement given...Ch. 6 - Prob. 6.40AECh. 6 - Prob. 6.41BECh. 6 - Prepare income statement in two formats (Learning...Ch. 6 - Use unit cost data to forecast total costs...Ch. 6 - Prob. 6.44BECh. 6 - Sustainability and cost estimation (Learning...Ch. 6 - Create a scatter plot (Learning Objective 3) Tammy...Ch. 6 - Continuation of E6-46B: High-low method (Learning...Ch. 6 - Prob. 6.48BECh. 6 - Prob. 6.49BECh. 6 - Prob. 6.50BECh. 6 - Using the high-low method to predict overhead for...Ch. 6 - Using regression analysis output to predict...Ch. 6 - Prob. 6.53BECh. 6 - Prob. 6.54BECh. 6 - Prob. 6.55BECh. 6 - Prob. 6.56BECh. 6 - Prob. 6.57BECh. 6 - Prob. 6.58BECh. 6 - Prob. 6.59BECh. 6 - Prepare a variable costing income statement given...Ch. 6 - Prob. 6.61BECh. 6 - Analyze cost behavior at a hospital using various...Ch. 6 - Analyze cost behavior (Learning Objectives 1, 2,...Ch. 6 - Prob. 6.64APCh. 6 - Prob. 6.65APCh. 6 - Prob. 6.66APCh. 6 - Analyze cost behavior at a hospital using various...Ch. 6 - Analyze cost behavior (Learning Objectives 1, 2,...Ch. 6 - Prepare traditional and contribution margin income...Ch. 6 - Prob. 6.70BPCh. 6 - Prob. 6.71BPCh. 6 - Prob. 6.72SCCh. 6 - Cost Behavior in Real Companies Choose a company...Ch. 6 - Ethics of building inventory (Learning Objective...Ch. 6 - Prob. 6.76ACT
Knowledge Booster


Learn more about
Need a deep-dive on the concept behind this application? Look no further. Learn more about this topic, accounting and related others by exploring similar questions and additional content below.Similar questions
- Use the following information to answer the questions that follow. A. Calculate the operating income percentage for each of the courses. Comment on how your analysis has changed for each course. B. Perform a vertical analysis for each course. Based on your analysis, what accounts would you want to investigate further? How might management utilize this information? C. Which method of analysis (using a dollar value or percentage) is most relevant and/or useful? Explainarrow_forwardRefer to Cornerstone Exercise 3.4 for data on Dohini Manufacturing Company’s purchasing cost and number of purchase orders.The controller for Dohini Manufacturing ran regression on the data, and the coefficients shown by the regression program are: Intercept 15,021 (rounded to the nearest dollar)X variable 1 9.74 (rounded to the nearest cent) Required: 1. Construct the cost formula for the purchasing activity showing the fixed cost and the vari-able rate. 2. If Dohini Manufacturing Company estimates that next month will have 430 purchaseorders, what is the total estimated purchasing cost for that month? (Round your answer tothe nearest dollar.)3. What if Dohini Manufacturing wants to estimate purchasing cost for the coming year andexpects 5,340 purchase orders? What will estimated total purchasing cost be? (Round youranswer to the nearest dollar.) What is the total fixed purchasing cost? Why doesn’t it equalthe fixed cost calculated in Requirement 1?arrow_forwardAssume you are the manager responsible for implementing a new service. The time to perform the service is subject to the learning curve. Would you prefer that the new service have a learning rate of 85 percent or 80 percent? Why?arrow_forward
- The following if-then statements were taken from a Balanced Scorecard: a. If employee capabilities increase, then process time decreases. b. If process time decreases, then customer retention will increase. c. If customer retention increases, then market share will increase. d. If market share increases, then revenues will increase. Required: 1. Identify the lead and lag variables, and explain your reasoning. 2. Discuss the implications of Requirement 1 for the financial and learning and growth perspectives. 3. Using the first if-then statement, explain the concept of double-loop feedback.arrow_forwardAnalysis of Regression Results Wang Manufacturing uses regression analysis to predict manufacturing overhead costs based on direct labor hours and/or machine hours and has developed thethree following regression equations:Regression 1 Regression 2 Regression 3SE 33,844 45,383 31,044R-squared 0.55 0.35 0.58t-values:Direct labor hours 2.3 1.9Machine hours 1.1 0.8Required Which regression would you choose and why?arrow_forwardA production company manager identify three items namely Item A, Item B and Item C are major contributors to the profit of the company. He found the p-values of each of the item from the multiple regression ANOVA table as follows. Item A 0.035 Item B 0.0305 Item C 0.03005 The most significant contributor item of the company profit? Select one: O a. All Item Ob. Item B O c. Item C Od. Non of the item Oe. Item Aarrow_forward
- Refer to Cornerstone Exercise 3.4 for data on Dohini Manufacturing Companys purchasing cost and number of purchase orders. The controller for Dohini Manufacturing ran regression on the data, and the coefficients shown by the regression program are: Required: 1. Construct the cost formula for the purchasing activity showing the fixed cost and the variable rate. 2. If Dohini Manufacturing Company estimates that next month will have 430 purchase orders, what is the total estimated purchasing cost for that month? (Round your answer to the nearest dollar.) 3. What if Dohini Manufacturing wants to estimate purchasing cost for the coming year and expects 5,340 purchase orders? What will estimated total purchasing cost be? (Round your answer to the nearest dollar.) What is the total fixed purchasing cost? Why doesnt it equal the fixed cost calculated in Requirement 1?arrow_forwardThe initial analysis should include the following: The ratio equation The calculation of the ratio using the equation and the pre-assigned Quick Study or Exercise from the textbook. Use the result in a sentence; i.e. For every dollar invested in assets the company is earning 22.4 cents or 22.4% in net income. Then explain whether this is a good result or a result that needs improving. The original post should include at least 7 sentencesarrow_forwardAssume there are 3,600 cases in the validation dataset, and 12% of these cases have a value of 1 for churn (the primary/positive event). Questions a) to c) are based on data for the 3,600 cases (see table below). Depth (% Contacted) Model Cumulative Gain Cumulative Lift Decision Tree 34.42 6.84 Logistic Regression Neural Network 20.19 4.01 34.62 6.88 Decision Tree Logistic Regression Neural Network 10 64.90 6.06 10 36.06 3.15 10 62.50 5.54 Decision Tree 15 73.96 1.82 Logistic Regression Neural Network 15 49.04 2.62 15 82.21 3.97 Decision Tree Logistic Regression 20 78.39 0.87 20 59.13 2.01 Neural Network 20 86.54 0.86 a) Which model has the highest Cumulative Lift at a depth of 20%? What is the lift? b) If the Cumulative Gain at a depth of 10% for the Decision Tree is converted to number of primary/positive event cases, what will be the number of cases? Show your calculation. c) If the Cumulative Gain at a depth of 15% for the Neural Network model is converted to number of…arrow_forward
- Carter Dry Cleaning has developed two regression analyses for cost estimation. The accounting manager has presented statistical measures for both of these regressions. Regression A has an R-squaredvalue of .53 and a t-value of 1.08. Regression B has an R-squared of .89 and a t-value of 2.17. Whatdo these statistical measures indicate about the regressions? Which regression should Carter DryCleaning use for cost estimation?arrow_forwardClassify each of the following performance measures into the balanced scorecard perspective to which it relates: financial perspective, internal operations perspective, learning and growth perspective, or customer perspective. A. Number of improved products B. Time from packaging to delivery or display C. Production costs D. Number of customer suggestions E. Sales mix revenues F. Number of repeat customersarrow_forwardQ1)What is the interpretation of beta? Provide one (numerical) example. Q2)What was the main learning outcome with the case that involved Lyxor ChinaH, Lyxor MSIndia and Lyxor USDJIA? Briefly explain.arrow_forward
arrow_back_ios
SEE MORE QUESTIONS
arrow_forward_ios
Recommended textbooks for you
 Essentials of Business Analytics (MindTap Course ...StatisticsISBN:9781305627734Author:Jeffrey D. Camm, James J. Cochran, Michael J. Fry, Jeffrey W. Ohlmann, David R. AndersonPublisher:Cengage Learning
 Cornerstones of Cost Management (Cornerstones Ser...AccountingISBN:9781305970663Author:Don R. Hansen, Maryanne M. MowenPublisher:Cengage Learning
 Principles of Accounting Volume 2AccountingISBN:9781947172609Author:OpenStaxPublisher:OpenStax College
- Century 21 Accounting Multicolumn JournalAccountingISBN:9781337679503Author:GilbertsonPublisher:Cengage
 Essentials Of Business AnalyticsStatisticsISBN:9781285187273Author:Camm, Jeff.Publisher:Cengage Learning,
Essentials of Business Analytics (MindTap Course ...
Statistics
ISBN:9781305627734
Author:Jeffrey D. Camm, James J. Cochran, Michael J. Fry, Jeffrey W. Ohlmann, David R. Anderson
Publisher:Cengage Learning
Cornerstones of Cost Management (Cornerstones Ser...
Accounting
ISBN:9781305970663
Author:Don R. Hansen, Maryanne M. Mowen
Publisher:Cengage Learning
Principles of Accounting Volume 2
Accounting
ISBN:9781947172609
Author:OpenStax
Publisher:OpenStax College
Century 21 Accounting Multicolumn Journal
Accounting
ISBN:9781337679503
Author:Gilbertson
Publisher:Cengage
Essentials Of Business Analytics
Statistics
ISBN:9781285187273
Author:Camm, Jeff.
Publisher:Cengage Learning,
Economic Value Added EVA - ACCA APM Revision Lecture; Author: OpenTuition;https://www.youtube.com/watch?v=_3hpcMFHPIU;License: Standard Youtube License