
(a)
Interpretation:
The diameter of the tensile bar is 0.505in. From a Cu-Ni alloy, this tensile bar is machined to 2.00 in gage length. The following data is observed.
| Load (lbs) | Gage length (in.) |
| 0 | 2.00000 |
| 1000 | 2.00045 |
| 2000 | 2.00091 |
| 3000 | 2.00136 |
| 4000 | 2.0020 |
| 6000 | 2.020 |
| 8000 | 2.052 |
| 10,000 | 2.112 |
| 11,000 | 2.80 (maximum load) |
| 9000 | 2.750 (fracture) |
Gage length and diameter was 2.75 in. and 0.365 in. respectively after the fracture.
For the observed data engineering stress and strain, the curve is to be plotted. From the plot, 0.2% offset yield strength needs to be determined.
Concept Introduction:
Following formula will be used for the calculation-
And
Answer to Problem 6.35P
Yield strength at 0.2 % offset is 28,000 psi.
Explanation of Solution
Diameter of bar = 0.505in
Therefore the area of cross-section of the bar is-
Where d is the diameter.
Put the value of d in (1):
Area = 0.200296 in2
Stress is given as force per unit area. The mathematical expression is given below-
Where s = stress
P= applied load
A = area
The strain is used to measure the amount of deformation caused by the applied load. The mathematical expression is given below-
Where,
So,
Where,
lf = final length
lo = initial length
Given value-
Length of bar or initial length = 2.00 in
Tabulate form for stress and strain data-
| Load (P) lb | Area in2 | stress psi | Gauge length ( lf) in. | Change in length ( | Strain
|
| 0 | 0.2002296 | 0 | 2.00000 | 0.00000 | 0 |
| 1,000 | 0.2002296 | 4992.61 | 2.00045 | 0.00045 | 0.000225 |
| 2,000 | 0.2002296 | 9985.22 | 2.00091 | 0.00091 | 0.000455 |
| 3,000 | 0.2002296 | 14977.83 | 2.00136 | 0.00136 | 0.00068 |
| 4,000 | 0.2002296 | 19970.44 | 2.0020 | 0.0020 | 0.0010 |
| 6,000 | 0.2002296 | 29955.66 | 2.020 | 0.020 | 0.01 |
| 8,000 | 0.2002296 | 39940.89 | 2.052 | 0.052 | 0.026 |
| 10,000 | 0.2002296 | 49926.11 | 2.112 | 0.112 | 0.056 |
| 11,000(max load) | 0.2002296 | 54918.72 | 2.280 | 0.280 | 0.140 |
| 9,000(fracture) | 0.2002296 | 44933.50 | 2.750 | 0.750 | 0.375 |
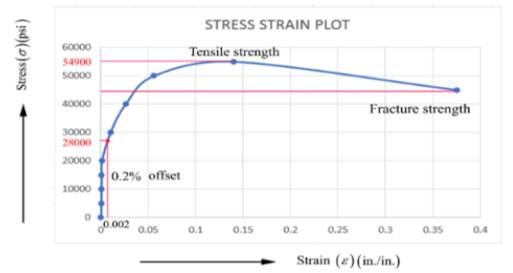
Stress-Strain curve based on above tabulated data-

From the above plot 0.2% offset yield strength is calculated as follows-
For calculation draw a line which is parallel to the stress and strain and meets the curve at 0.2 % offset. The value of stress at 0.2% offset is called as yield strength which is 28,000 psi.
Yield strength at 0.2 % offset = 28,000 psi.
(b)
Interpretation:
The tensile strength of the bar needs to be calculated from observed data and engineering stress and strain curve.
Concept Introduction:
Following formula will be used for the calculation-
And
Answer to Problem 6.35P
Tensile strength of the bar is 54900 psi from the stress-strain curve.
Explanation of Solution
Stress-Strain curve based on above tabulated data of section (a)-

Tensile strength of the material is the ability of the material to withstand the pulling force.
From the above plot, the obtained tensile strength value is 54900 psi.
Tensile strength = 54900 psi.
(c)
Interpretation:
The modulus of elasticity of bar needs to be calculated from observed data and engineering stress and strain curve.
Concept Introduction:
Following formula will be used for the calculation-
And
Answer to Problem 6.35P
Modulus of elasticity of bar is
Explanation of Solution
| Load (P) lb | Area in2 | stress psi | Gauge length ( lf) in. | Change in length ( | Strain
|
| 0 | 0.2002296 | 0 | 2.00000 | 0.00000 | 0 |
| 1,000 | 0.2002296 | 4992.61 | 2.00045 | 0.00045 | 0.000225 |
| 2,000 | 0.2002296 | 9985.22 | 2.00091 | 0.00091 | 0.000455 |
| 3,000 | 0.2002296 | 14977.83 | 2.00136 | 0.00136 | 0.00068 |
| 4,000 | 0.2002296 | 19970.44 | 2.0020 | 0.0020 | 0.0010 |
| 6,000 | 0.2002296 | 29955.66 | 2.020 | 0.020 | 0.01 |
| 8,000 | 0.2002296 | 39940.89 | 2.052 | 0.052 | 0.026 |
| 10,000 | 0.2002296 | 49926.11 | 2.112 | 0.112 | 0.056 |
| 11,000(max load) | 0.2002296 | 54918.72 | 2.280 | 0.280 | 0.140 |
| 9,000(fracture) | 0.2002296 | 44933.50 | 2.750 | 0.750 | 0.375 |
Stress-Strain curve based on tabulating data of section (a)-

Modulus of elasticity is obtained by the Hooke's law. It is the ratio of stress and strain which is given as-
From the table-
s = 9985.22 psi
e = 0.000455
Put the above values in (1)
Modulus of elasticity =
(d)
Interpretation:
The percentage of elongation of the bar needs to be calculated from observed data and engineering stress and strain curve.
Concept Introduction:
Following formula will be used for calculation-
And
Answer to Problem 6.35P
The percentage of elongation of the bar by observed data and engineering stress and strain curve is 37.5%.
Explanation of Solution
| Load (P) lb | Area in2 | stress psi | Gauge length ( lf) in. | Change in length ( | Strain
|
| 0 | 0.2002296 | 0 | 2.00000 | 0.00000 | 0 |
| 1,000 | 0.2002296 | 4992.61 | 2.00045 | 0.00045 | 0.000225 |
| 2,000 | 0.2002296 | 9985.22 | 2.00091 | 0.00091 | 0.000455 |
| 3,000 | 0.2002296 | 14977.83 | 2.00136 | 0.00136 | 0.00068 |
| 4,000 | 0.2002296 | 19970.44 | 2.0020 | 0.0020 | 0.0010 |
| 6,000 | 0.2002296 | 29955.66 | 2.020 | 0.020 | 0.01 |
| 8,000 | 0.2002296 | 39940.89 | 2.052 | 0.052 | 0.026 |
| 10,000 | 0.2002296 | 49926.11 | 2.112 | 0.112 | 0.056 |
| 11,000(max load) | 0.2002296 | 54918.72 | 2.280 | 0.280 | 0.140 |
| 9,000(fracture) | 0.2002296 | 44933.50 | 2.750 | 0.750 | 0.375 |
Stress-Strain curve on the basis of tabulating data of section (a)-

The percentage of elongation is the amount of deformation in the length of the bar.
It is calculated by using the following formula-
From table- lf ( final length) or fracture length = 2.75 in.
And given value −
lo( initial length) = 2 in.
Put the above values in Equ (1)
(e)
Interpretation:
The percentage of reduction in the area of the bar needs to be calculated from observed data and engineering stress and strain curve.
Concept Introduction:
Following formula will be used for the calculation-
And
Answer to Problem 6.35P
The percentage of reduction in the area of the bar by using observed data and engineering stress and strain curve is 47.76%.
Explanation of Solution
| Load (P) lb | Area in2 | stress psi | Gauge length ( lf) in. | Change in length ( | Strain |
| 0 | 0.2002296 | 0 | 2.00000 | 0.00000 | 0 |
| 1,000 | 0.2002296 | 4992.61 | 2.00045 | 0.00045 | 0.000225 |
| 2,000 | 0.2002296 | 9985.22 | 2.00091 | 0.00091 | 0.000455 |
| 3,000 | 0.2002296 | 14977.83 | 2.00136 | 0.00136 | 0.00068 |
| 4,000 | 0.2002296 | 19970.44 | 2.0020 | 0.0020 | 0.0010 |
| 6,000 | 0.2002296 | 29955.66 | 2.020 | 0.020 | 0.01 |
| 8,000 | 0.2002296 | 39940.89 | 2.052 | 0.052 | 0.026 |
| 10,000 | 0.2002296 | 49926.11 | 2.112 | 0.112 | 0.056 |
| 11,000(max load) | 0.2002296 | 54918.72 | 2.280 | 0.280 | 0.140 |
| 9,000(fracture) | 0.2002296 | 44933.50 | 2.750 | 0.750 | 0.375 |
Stress-Strain curve on the basis of tabulating data of section (a)-

% reduction in the area of the bar is determined by using the following formula which is given as-
Where,
Ao = initial area
Af = final area
Where d is the diameter of the bar.
From observed table-
df = 0.365 in.
Given value-
do = 0.505 in.
Put the above values in Equ (1) :
(f)
Interpretation:
The engineering stress at the fracture needs to be calculated from observed data and engineering stress and strain curve.
Concept Introduction:
Following formula will be used for the calculation-
And
Answer to Problem 6.35P
The engineering stress at the fracture is 44900 psi obtained from the plot.
Explanation of Solution
Stress-Strain curve on the basis of tabulating data of section (a)-
Engineering stress is defined as the force per unit area. The mathematical expression of engineering stress is given as-
From the plot of engineering stress and strain curve, the value of stress at the fracture is 44900 psi.
(g)
Interpretation:
The true stress at necking of bar is needs to be calculated from observed data and engineering stress and strain curve.
Concept Introduction:
Following formula will be used for the calculation-
The Relation between true stress and strain is-
Answer to Problem 6.35P
Stress at the necking of bar is 61783 psi.
Explanation of Solution
| Load (P) lb | Area in2 | stress psi | Gauge length ( lf) in. | Change in length ( | Strain |
| 0 | 0.2002296 | 0 | 2.00000 | 0.00000 | 0 |
| 1,000 | 0.2002296 | 4992.61 | 2.00045 | 0.00045 | 0.000225 |
| 2,000 | 0.2002296 | 9985.22 | 2.00091 | 0.00091 | 0.000455 |
| 3,000 | 0.2002296 | 14977.83 | 2.00136 | 0.00136 | 0.00068 |
| 4,000 | 0.2002296 | 19970.44 | 2.0020 | 0.0020 | 0.0010 |
| 6,000 | 0.2002296 | 29955.66 | 2.020 | 0.020 | 0.01 |
| 8,000 | 0.2002296 | 39940.89 | 2.052 | 0.052 | 0.026 |
| 10,000 | 0.2002296 | 49926.11 | 2.112 | 0.112 | 0.056 |
| 11,000(max load) | 0.2002296 | 54918.72 | 2.280 | 0.280 | 0.140 |
| 9,000(fracture) | 0.2002296 | 44933.50 | 2.750 | 0.750 | 0.375 |
Stress-Strain curve on the basis of tabulating data of section (a)-

Strain the maximum load is −
l = guage length
lo = initial length
From table-
l = 2.75 in.
Given value
lo = 2.00 in.
Put the above values in Equ(1)
True stress at the necking is calculated by −
P = 9000 lbs (from table)
do = 0.505 in.
Put the above values in Equ (2)
Stress at the necking =
(h)
Interpretation:
The modulus of resilience of bar needs to be calculated from observed data and engineering stress and strain curve.
Concept Introduction:
Following formula will be used for the calculation-
And
Answer to Problem 6.35P
The modulus of resilience of bar is 10 psi.
Explanation of Solution
| Load (P) lb | Area in2 | stress psi | Gauge length ( of) in. | Change in length ( | Strain |
| 0 | 0.2002296 | 0 | 2.00000 | 0.00000 | 0 |
| 1,000 | 0.2002296 | 4992.61 | 2.00045 | 0.00045 | 0.000225 |
| 2,000 | 0.2002296 | 9985.22 | 2.00091 | 0.00091 | 0.000455 |
| 3,000 | 0.2002296 | 14977.83 | 2.00136 | 0.00136 | 0.00068 |
| 4,000 | 0.2002296 | 19970.44 | 2.0020 | 0.0020 | 0.0010 |
| 6,000 | 0.2002296 | 29955.66 | 2.020 | 0.020 | 0.01 |
| 8,000 | 0.2002296 | 39940.89 | 2.052 | 0.052 | 0.026 |
| 10,000 | 0.2002296 | 49926.11 | 2.112 | 0.112 | 0.056 |
| 11,000(max load) | 0.2002296 | 54918.72 | 2.280 | 0.280 | 0.140 |
| 9,000(fracture) | 0.2002296 | 44933.50 | 2.750 | 0.750 | 0.375 |
Stress-Strain curve on the basis of tabulating data of section (a)-

The modulus of resilience can be explained as the amount of maximum energy absorbed by the material without any permanent deformation.
It is given as-
Where,
sy = yield stress
ey = yield strain
From the plot-
sy = 2000 psi
ey = 0.001
Put above values in Eq (1)
Want to see more full solutions like this?
Chapter 6 Solutions
Essentials Of Materials Science And Engineering

 MATLAB: An Introduction with ApplicationsEngineeringISBN:9781119256830Author:Amos GilatPublisher:John Wiley & Sons Inc
 Essentials Of Materials Science And EngineeringEngineeringISBN:9781337385497Author:WRIGHT, Wendelin J.Publisher:Cengage,
 Industrial Motor ControlEngineeringISBN:9781133691808Author:Stephen HermanPublisher:Cengage Learning
 Basics Of Engineering EconomyEngineeringISBN:9780073376356Author:Leland Blank, Anthony TarquinPublisher:MCGRAW-HILL HIGHER EDUCATION
 Structural Steel Design (6th Edition)EngineeringISBN:9780134589657Author:Jack C. McCormac, Stephen F. CsernakPublisher:PEARSON
 Fundamentals of Materials Science and Engineering...EngineeringISBN:9781119175483Author:William D. Callister Jr., David G. RethwischPublisher:WILEY