Applied Statistics in Business and Economics with Connect Access Card with LearnSmart
5th Edition
ISBN: 9781259396656
Author: David Doane, Lori Seward Senior Instructor of Operations Management
Publisher: McGraw-Hill Education
bartleby

Concept explainers

bartleby

Videos

Question
Book Icon
Chapter 6, Problem 64CE

(a)

To determine

Generate the 1,000 random numbers between 1 through 5.

Find the expected mean and standard deviation.

(a)

Expert Solution
Check Mark

Answer to Problem 64CE

The mean value for the numbers between 1 and 5 is 3.

The standard deviation value for the numbers between 1 and 5 is 1.414.

Explanation of Solution

Calculation:

Generate 1,000 random numbers:

The formula to generate random numbers between two numbers by using EXCEL is RANDBETWEEN (bottom, top).

Software procedure:

Step by step procedure to obtain the 1,000 random numbers by using EXCEL software:

  • • Open EXCEL.
  • • In cell A1, enter the value as “=RANDBETWEEN(1,5)”.

Output using EXCEL software is given as follows:

4524522245...5535124423
32455334535545241552
34525524211242431535
54545321251331543225
54213223544254324443
44324353452342514153
25452454343532251554
45125125534134435133
44113544221311133515
21141134125535124423

Uniform distribution:

The random variable with a finite number of integers from a and b follows uniform distribution with parameters a and b.

The PDF of the distribution is,

P(X=x)=1ba+1.

The formula for mean is,

μ=a+b2.

The formula for standard deviation is,

σ=[(ba)+1]2112

The mean value for values between 1 and 5 is,

μ=1+52=62=3

Thus, the value of mean for 1,000 random numbers between 1 and 5 is 3.

The standard deviation value for values between 1 and 5 is,

σ=[(51)+1]2112=[(4)+1]2112=[5]2112

   =25112=2412=2=1.414

Thus, the value of standard deviation value for 1,000 random numbers between 1 and 5 is 1.414.

(b)

To determine

Find the sample mean and standard deviation.

(b)

Expert Solution
Check Mark

Answer to Problem 64CE

The sample mean value for the numbers between 1 and 5 is 3.013.

The sample standard deviation value for the numbers between 1 and 5 is 1.4137.

Explanation of Solution

Calculation:

Answer will vary. One of the possible answer is given below:

Sample mean:

Software procedure:

Step by step procedure to obtain the sample mean for 1,000 random numbers by using EXCEL software:

  • • Enter the formula “=AVERAGE (A1:A1000).

Output using EXCEL software is given as follows:

Applied Statistics in Business and Economics with Connect Access Card with LearnSmart, Chapter 6, Problem 64CE , additional homework tip  1

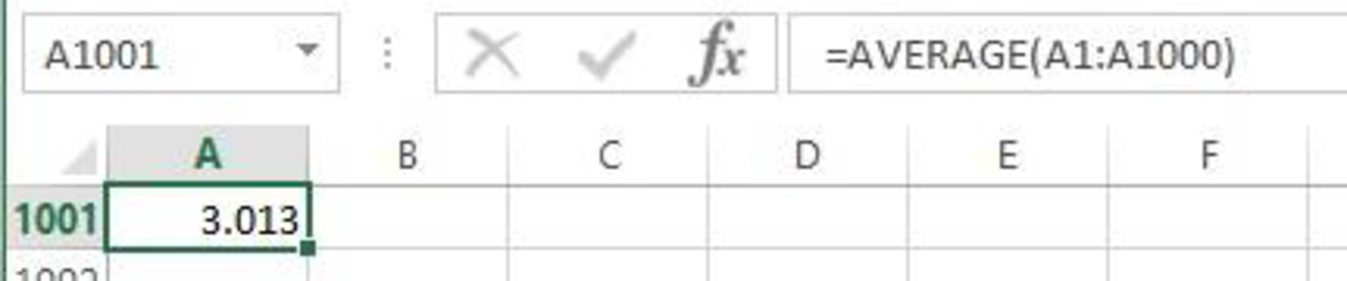
Thus, the value of sample mean for 1,000 random numbers between 1 and 5 is 3.013.

Sample standard deviation:

Software procedure:

Step by step procedure to obtain the sample mean for 1,000 random numbers by using EXCEL software:

  • • Enter the formula “=STDEVA (A1:A1000).

Output using EXCEL software is given as follows:

Applied Statistics in Business and Economics with Connect Access Card with LearnSmart, Chapter 6, Problem 64CE , additional homework tip  2

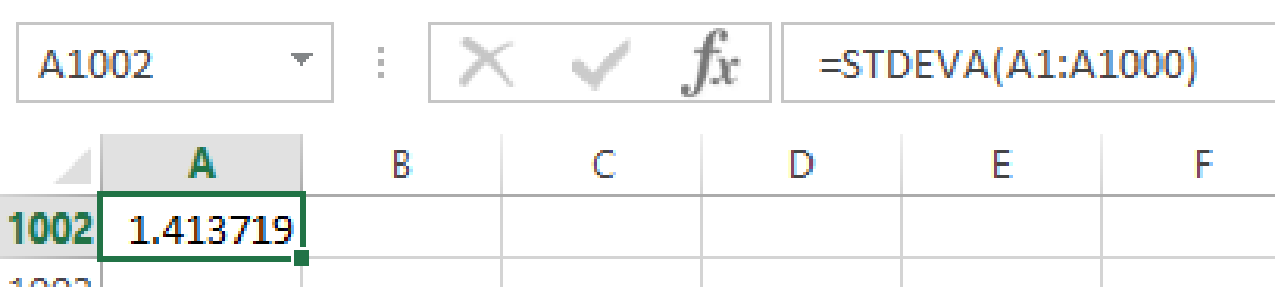
Thus, the value of sample standard deviation for 1,000 random numbers between 1 and 5 is 1.4137.

(c)

To determine

Check the sample is consistent with uniform model.

(c)

Expert Solution
Check Mark

Answer to Problem 64CE

The sample is consistent with uniform model.

Explanation of Solution

Calculation:

Answer will vary. One of the possible answer is given:

From the result of part (a): the results are drawn from the uniform distribution.

The mean value for the numbers between 1 and 5 is 3 and the standard deviation value for the numbers between 1 and 5 is 1.414.

From the result of part (b): the results are drawn from the samples.

The sample mean value for the numbers between 1 and 5 is 3.013 and the sample standard deviation value for the numbers between 1 and 5 is 1.4137.

By observing the results, in both cases the results are same. Thus, the sample is consistent with uniform model.

(d)

To determine

Give the EXCEL formulae used to generate random numbers.

(d)

Expert Solution
Check Mark

Explanation of Solution

Generate the 1,000 random numbers between 1 through 5 is “=RANDBETWEEN(1,5)”.

Want to see more full solutions like this?

Subscribe now to access step-by-step solutions to millions of textbook problems written by subject matter experts!

Chapter 6 Solutions

Applied Statistics in Business and Economics with Connect Access Card with LearnSmart

Ch. 6.3 - Prob. 11SECh. 6.3 - Prob. 12SECh. 6.4 - List the X values that are included in each...Ch. 6.4 - Write the probability of each italicized event in...Ch. 6.4 - Find the mean and standard deviation for each...Ch. 6.4 - Prob. 16SECh. 6.4 - Calculate each binomial probability: a. X = 5, n =...Ch. 6.4 - Calculate each binomial probability: a. X = 2, n =...Ch. 6.4 - Prob. 19SECh. 6.4 - Prob. 20SECh. 6.4 - Prob. 21SECh. 6.4 - Calculate each binomial probability: a. Fewer than...Ch. 6.4 - In the Ardmore Hotel, 20 percent of the customers...Ch. 6.4 - Historically, 5 percent of a mail-order firms...Ch. 6.4 - At a Noodles Company restaurant, the probability...Ch. 6.4 - J.D. Power and Associates says that 60 percent of...Ch. 6.4 - Prob. 27SECh. 6.4 - Police records in the town of Saratoga show that...Ch. 6.5 - Find the mean and standard deviation for each...Ch. 6.5 - Find the mean and standard deviation for each...Ch. 6.5 - Calculate each Poisson probability: a. P(X = 6), ...Ch. 6.5 - Prob. 32SECh. 6.5 - Calculate each compound event probability: a. P(X ...Ch. 6.5 - Calculate each compound event probability: a. P(X ...Ch. 6.5 - Prob. 35SECh. 6.5 - Prob. 36SECh. 6.5 - According to J.D. Power and Associates 2006...Ch. 6.5 - At an outpatient mental health clinic, appointment...Ch. 6.5 - The average number of items (such as a drink or...Ch. 6.5 - (a) Why might the number of yawns per minute by...Ch. 6.5 - Prob. 41SECh. 6.5 - Prob. 42SECh. 6.5 - Prob. 43SECh. 6.5 - Prob. 44SECh. 6.5 - The probability that a passenger's bag will be...Ch. 6.6 - (a) State the values that X can assume in each...Ch. 6.6 - ABC Warehouse has eight refrigerators in stock....Ch. 6.6 - A statistics textbook chapter contains 60...Ch. 6.6 - Fifty employee travel expense reimbursement...Ch. 6.6 - A medical laboratory receives 40 blood specimens...Ch. 6.6 - Prob. 51SECh. 6.6 - Two hundred employee travel expense reimbursement...Ch. 6.6 - A law enforcement agency processes 500 background...Ch. 6.6 - Four hundred automobiles arc to be inspected for...Ch. 6.7 - Find each geometric probability. a. P(X = 5) when ...Ch. 6.7 - In the Ardmore Hotel. 20 percent of the guests...Ch. 6.7 - Prob. 57SECh. 6.8 - The height of a Los Angeles Lakers basketball...Ch. 6.8 - The height of a Los Angeles Lakers basketball...Ch. 6.8 - Prob. 60SECh. 6.8 - Prob. 61SECh. 6 - Define (a) random process, (b) random variable,...Ch. 6 - Without using formulas, explain the meaning of (a)...Ch. 6 - What is the difference between a PDF and a CDF?...Ch. 6 - (a) What are the two parameters of a uniform...Ch. 6 - (a) Describe a Bernoulli experiment and give two...Ch. 6 - Prob. 6CRCh. 6 - (a) What are the parameters of a Poisson...Ch. 6 - In the binomial and Poisson models, why is the...Ch. 6 - (a) When are we justified in using the Poisson...Ch. 6 - Prob. 10CRCh. 6 - When are we justified in using (a) the Poisson...Ch. 6 - Name a situation when we would need the (a)...Ch. 6 - What do Rules 1 and 2 say about transforming a...Ch. 6 - What do Rules 3 and 4 say about sums of several...Ch. 6 - In Rule 5, what does the covariance measure? What...Ch. 6 - The probability that a 30-year-old white male will...Ch. 6 - Prob. 63CECh. 6 - Prob. 64CECh. 6 - Prob. 66CECh. 6 - In a certain year, on average 10 percent of the...Ch. 6 - The probability that an American CEO can transact...Ch. 6 - In a certain Kentucky Fried Chicken franchise,...Ch. 6 - In a certain Kentucky Fried Chicken franchise,...Ch. 6 - Write the Excel binomial formula for each...Ch. 6 - Tired of careless spelling and grammar, a company...Ch. 6 - Prob. 73CECh. 6 - Prob. 74CECh. 6 - Prob. 75CECh. 6 - Write the Excel formula for each Poisson...Ch. 6 - A small feeder airline knows that the probability...Ch. 6 - Although television HDTV converters are tested...Ch. 6 - Prob. 79CECh. 6 - There is a 70 percent chance that an airline...Ch. 6 - Lunch customers arrive at a Noodles Company...Ch. 6 - In a major league baseball game, the average is...Ch. 6 - Prob. 83CECh. 6 - In a recent year, potentially dangerous commercial...Ch. 6 - At an outpatient mental health clinic, appointment...Ch. 6 - Prob. 86CECh. 6 - Prob. 87CECh. 6 - Past insurance company audits have found that 2...Ch. 6 - Prob. 89CECh. 6 - In Northern Yellowstone Lake, earthquakes occur at...Ch. 6 - On New Yorks Verrazano Narrows bridge, traffic...Ch. 6 - Leaks occur in a pipeline at a mean rate of 1 leak...Ch. 6 - Prob. 93CECh. 6 - The probability is .03 that a passenger on United...Ch. 6 - Prob. 95CECh. 6 - On average, 2 percent of all persons who are given...Ch. 6 - Prob. 97CECh. 6 - Prob. 99CECh. 6 - The probability that a bakery customer will order...Ch. 6 - Prob. 101CECh. 6 - For patients aged 81 to 90, the probability is .07...Ch. 6 - Prob. 103CECh. 6 - Prob. 104CECh. 6 - Prob. 105CECh. 6 - The Rejuvo Corp. manufactures granite countertop...Ch. 6 - Prob. 107CECh. 6 - Prob. 108CECh. 6 - Prob. 109CECh. 6 - Prob. 110CECh. 6 - Malaprop Ltd. sells two products. Daily sales of...
Knowledge Booster
Background pattern image
Statistics
Learn more about
Need a deep-dive on the concept behind this application? Look no further. Learn more about this topic, statistics and related others by exploring similar questions and additional content below.
Recommended textbooks for you
Text book image
MATLAB: An Introduction with Applications
Statistics
ISBN:9781119256830
Author:Amos Gilat
Publisher:John Wiley & Sons Inc
Text book image
Probability and Statistics for Engineering and th...
Statistics
ISBN:9781305251809
Author:Jay L. Devore
Publisher:Cengage Learning
Text book image
Statistics for The Behavioral Sciences (MindTap C...
Statistics
ISBN:9781305504912
Author:Frederick J Gravetter, Larry B. Wallnau
Publisher:Cengage Learning
Text book image
Elementary Statistics: Picturing the World (7th E...
Statistics
ISBN:9780134683416
Author:Ron Larson, Betsy Farber
Publisher:PEARSON
Text book image
The Basic Practice of Statistics
Statistics
ISBN:9781319042578
Author:David S. Moore, William I. Notz, Michael A. Fligner
Publisher:W. H. Freeman
Text book image
Introduction to the Practice of Statistics
Statistics
ISBN:9781319013387
Author:David S. Moore, George P. McCabe, Bruce A. Craig
Publisher:W. H. Freeman
Continuous Probability Distributions - Basic Introduction; Author: The Organic Chemistry Tutor;https://www.youtube.com/watch?v=QxqxdQ_g2uw;License: Standard YouTube License, CC-BY
Probability Density Function (p.d.f.) Finding k (Part 1) | ExamSolutions; Author: ExamSolutions;https://www.youtube.com/watch?v=RsuS2ehsTDM;License: Standard YouTube License, CC-BY
Find the value of k so that the Function is a Probability Density Function; Author: The Math Sorcerer;https://www.youtube.com/watch?v=QqoCZWrVnbA;License: Standard Youtube License