
Videos
Throughout the picturesque valleys of mid-18th-century Germany echoed the song of the Neuländer (newlander), enticing journeymen who struggled to feed their families with the dream and promise of colonial America. The typical Neuländer sought to sign up several families from a village for immigration to a particular colony. By registering a group of neighbors, rather than isolated families, the agent increased the likelihood that his signees would not stray to the proposals of a competitor. Additionally, by signing large groups, the Neuländer fattened his purse, to the tune of one to two florins a head.
Generally, the Germans who chose to undertake the hardship of a trans-Atlantic voyage were poor, yet the cost of such a voyage was high. Records from a 1753 voyage indicate that the cost of an adult fare (one freight) from Rotterdam to Boston was 7.5 pistoles. Children aged 4 to 13 were assessed at half the adult rate (one-half freight) and those under 4 were not charged. To get a sense of the expense involved, an adult fare is equivalent to approximately $2000! Many immigrants did not have the necessary funds to purchase passage and, determined to make the crossing, paid with years of indentured servitude.
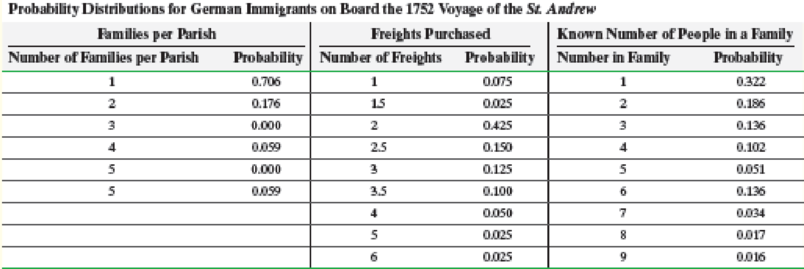
As a historian studying the influence of these German immigrants on colonial America, Hans Langenscheidt is interested in describing various demographic characteristics of these people. Unfortunately, accurate records are rare. He has discovered a partially reconstructed 1752 passenger list for a ship, the St. Andrew, containing the names of the heads of families, a list of family members traveling, their parish of origin, and the number of freights each family purchased. Unfortunately, some data are missing for some families. Langenscheidt believes that the demographic parameters of this passenger list are likely to be similar to those of the other voyages taken from Germany to America during the mid-18th century. Assuming that he is correct, he believes that it is appropriate to create a discrete probability distribution for a number of demographic variables for this population of German immigrants, presented below.
6. Summarize your findings in a report. Discuss any assumptions made throughout this analysis. What are the consequences to your calculations and conclusions if your assumptions are subsequently determined to be invalid?
Want to see the full answer?
Check out a sample textbook solution
Chapter 6 Solutions
Fundamentals of Statistics Plus MyLab Statistics with Pearson eText - Title-Specific Access Card Package (5th Edition)


- Emma's .. che-Go, a large convenience store that makes a good deal of money from magazine sales, has three possible locations in the store for its magazine rack: in the front of the store (to attract "impulse buying" by all customers), on the left-hand side of the store (to attract teenagers who are on that side of the store looking at the candy and soda), and in the back of the store (to attract the adults searching through the alcohol cases). The manager at Emma's experiments over the course of several months by rotating the magazine rack among the three locations, choosing a sample of 47 days at each location. Each day, the manager records the amount of money brought in from the sale of magazines. Below are the sample mean daily sales (in dollars) for each of the locations, as well as the sample variances: Sample Sample Sample size Group mean variance Front 47 218.7 648.0 Left-hand side 47 221.5 558.8 Right-hand side 47 213.8 314.3 Send data to calculator Send data to Excel Suppose…arrow_forwardIn a traditional class with in-class tests, a question that is often asked after a class exam is, "What was the class average?" If that question is asked and the professor says that the class average was 80, what information do the students gain by knowing that? I want you to focus on both what the individual students knows about their own grade as well as what the students know about the class's grades on that exam.arrow_forwardE. Sales manager Phil Forrester is trying to put together a sales team to cover the Los Angeles area. His team will consist of four members – two experienced and two new salesmen. • Sam, Fred, Harry, and Kim are the experienced salemen. • John, Tim, and Dom are new. Sam and Fred do not work together. Tim and Sam refuse to work together. Harry and Dom cannot work together. (10) If Sam is made part of the team, the following must be the other members: (A) John, Tim, Dom (B) John, Dom, Kim (C) Tim, Harry, Kim (D) Dom, John, Fred (11) Which one of the following must be true? (A) Fred and Sam always work together. (B) Kim and Dom never work together. (C) Kim and Fred always work together. (D) If Sam works, then Dom works.arrow_forward
- Kentville, a community of 10,000 people, resides next to a krypton mine, and there is a concern that the emission from the krypton smelter have resulted in adverse effects. Specifically, Kryptonosis seems to have killed 12 of Kentville’s inhabitants last year. A neighboring community, Lanesburg, has 25,000 inhabitants and is far enough from the smelter to not be affected by the emission. In Lanesburg, only three people last year died of Kryptonosis. Given that the number of deaths in Kentville and their causes last year were: Heart attack=7 Accidents=4 Kryptonosis=12 Other=6 What is the risk of dying of Kryptonosis in Kentville relative to non-contaminated locality?What is the risk of dying of Kryptonosis in Kentville relative to deaths due to other causes? How many times the chance of dying of Kryptonosis compared to dying of accidents ? How many times the chance of dying of Kryptonosis compared to Other causes?arrow_forwardIn an imaginary survey, we wanted to find out if there is a connection between morning sickness and sleeping position. A random sample of 400 people was selected for the survey. The respondent had to define himself as either a morning person or a non-morning person and tell the position in which he typically sleeps.186 respondents classified themselves as morning timers and 214 respondents as non-morning timers.Of the morning owls, 127 reported that they usually sleep on their side, 24 on their stomach and 35 on their back.Of the non-morning people, 156 reported that they usually sleep on their side, 29 on their stomach and 29 on their back.Use the chisq.test() function to test the null hypothesis that there is no connection between morning knitting and sleeping position. What is the p-value? Give the answer to four decimal places. Remember the correct decimal separator.arrow_forwardSeveral months ago while shopping, I was interviewed to see whether or not I'd be interested in signing up for a subscription to a yoga app. I fall into the category of people who have a membership at a local gym, and guessed that, like me, many people in that category would not be interested in the app. My friend Keisha falls in the category of people who do not have a membership at a local gym, and I was thinking that she might like a subscription to the app. After being interviewed, I looked at the interviewer's results. Of the 97 people in my market category who had been interviewed, 14 said they would buy a subscription, and of the 95 people in Keisha's market category, 30 said they would buy a subscription. Assuming that these data came from independent, random samples, can we conclude, at the 0.05 level of significance, that the proportion p, of all mall shoppers in my market category who would buy a subscription is less than the proportion p, of all mall shoppers in Keisha's…arrow_forward
- Please, solve these...arrow_forwardA friend who lives in Los Angeles makes frequent consultingtrips to Washington, D.C.; 50% of the time shetravels on airline #1, 30% of the time on airline #2, and the remaining 20% of the time on airline #3. For airline#1, flights are late into D.C. 30% of the time and late intoL.A. 10% of the time. For airline #2, these percentagesare 25% and 20%, whereas for airline #3 the percentagesare 40% and 25%. If we learn that on a particular trip shearrived late at exactly one of the two destinations, whatare the posterior probabilities of having flown on airlines#1, #2, and #3? Assume that the chance of a late arrival inL.A. is unaffected by what happens on the flight to D.C.[Hint: From the tip of each first-generation branch on atree diagram, draw three second-generation brancheslabeled, respectively, 0 late, 1 late, and 2 late.]arrow_forwardA marketing report concerning personal computers states that 650,000 owners will buy a printer for their machines next year and 1,250,000 will buy at least one software package. If the report states that 1,450,000 owners will buy either a printer or at least one software package, how many will buy both a printer and at least one software package?arrow_forward
- Dr. Loras Tyrell was curious to see if his students actually saved money by purchasing books from sources other than the college bookstore. He administered a survey to all his students asking how they obtained their book (Bookstore, Rented, ebook, or on the web – WebBooks) and how much they paid for the book. He obtained the information below. If the values for web-books are normally distributed, we know that of the students who purchased their book on the web (WebBooks), about 68.3% of those students paid approximately $----- to ----?arrow_forwardIndiana has a population of about 7 million people and Ohio about 12 million. Is it possible for there to be a poll where over 50% of Hoosiers say "yes", over 50% of Ohioans say "yes", but over 50% of all residents of both states say "no"? If no, explain why not. If yes, give an example of how that could happen.arrow_forwardTen new sales representatives for Clark Sprocket and Chain Inc. were required to attend a training program before being assigned to a regional sales office. At the end of the program, the representatives took a series of tests and the scores were ranked. For example, Arden had the lowest test score and is ranked 1; Arbuckle had the highest test score and is ranked 10. At the end of the first sales year, the representatives’ ranks based on test scores were paired with their first year sales. Ranking in Ranking in Annual Sales Training Annual Sales Training Representative ($ thousands) Program Representative ($ thousands) Program Kitchen 319 8 Arden 300 1 Bond 150 2 Crane 280 6 Gross 175 5 Arthur 200 9 Arbuckle 460 10 Keene 190 4 Greene 348 7 Knopf 300 3 a-2. Determine Spearman’s rank correlation coefficient. (Round your answer to 3 decimal places.)…arrow_forward
 MATLAB: An Introduction with ApplicationsStatisticsISBN:9781119256830Author:Amos GilatPublisher:John Wiley & Sons Inc
 Probability and Statistics for Engineering and th...StatisticsISBN:9781305251809Author:Jay L. DevorePublisher:Cengage Learning
 Statistics for The Behavioral Sciences (MindTap C...StatisticsISBN:9781305504912Author:Frederick J Gravetter, Larry B. WallnauPublisher:Cengage Learning
 Elementary Statistics: Picturing the World (7th E...StatisticsISBN:9780134683416Author:Ron Larson, Betsy FarberPublisher:PEARSON
 The Basic Practice of StatisticsStatisticsISBN:9781319042578Author:David S. Moore, William I. Notz, Michael A. FlignerPublisher:W. H. Freeman
 Introduction to the Practice of StatisticsStatisticsISBN:9781319013387Author:David S. Moore, George P. McCabe, Bruce A. CraigPublisher:W. H. Freeman