
Concept explainers
Videos
For the given set of tasks, do the following:
a. Develop the precedence diagram
b. Determine the minimum cycle time and then calculate the cycle time for a desired output of 500 units in a seven-hour day. Why might a manager use a cycle tune of 50 seconds?
c. Determine the minimum number of workstations for output of 500 units per day
d. Balance the line using the greatest positional weight heuristic. Break ties with the most following tasks heuristic. Use a cycle tune of 50 seconds.
e. Calculate the percentage idle time for the line.
a)
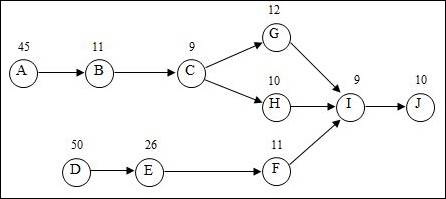
To draw: The precedence diagram.
Introduction:
Process selection:
It is the tactical choices made by a firm in picking the kind of production procedure to be followed in the process of production. The process is selected after reviewing many numbers of criteria and constraints.
Answer to Problem 7P
Precedence diagram:
Explanation of Solution
Given information:
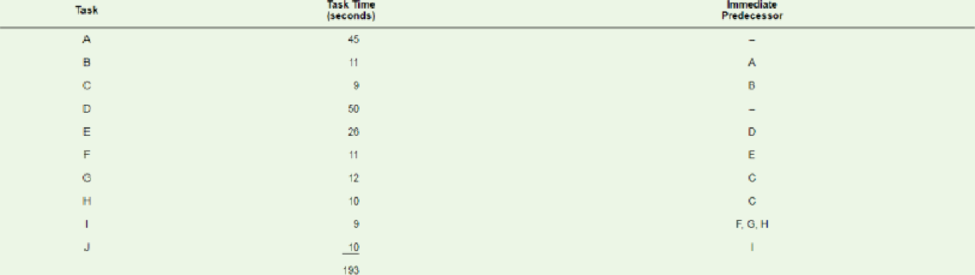
| Task | Task time (seconds) | Immediate predecessor |
| A | 45 | Nil |
| B | 11 | A |
| C | 9 | B |
| D | 50 | Nil |
| E | 26 | D |
| F | 11 | E |
| G | 12 | C |
| H | 10 | C |
| I | 9 | F, G , H |
| J | 10 | I |
| Total | 193 |
Precedence diagram:
The precedence diagram is drawn circles and arrows. The tasks are represented in circles and weights for each task are represented outside the circle. The arrows are represented to show which task is preceding the other task and so on.
b)
To determine: The minimum cycle time and the cycle time for the desired output.
Introduction:
Process selection:
It is the tactical choices made by a firm in picking the kind of production procedure to be followed in the process of production. The process is selected after reviewing many numbers of criteria and constraints.
Answer to Problem 7P
Explanation of Solution
Given information:
| Task | Task time (seconds) | Immediate predecessor |
| A | 45 | Nil |
| B | 11 | A |
| C | 9 | B |
| D | 50 | Nil |
| E | 26 | D |
| F | 11 | E |
| G | 12 | C |
| H | 10 | C |
| I | 9 | F, G , H |
| J | 10 | I |
| Total | 193 |
Operating hours per day = 7
Sum of all task times = 193 seconds
Desired output per day = 500
Calculation of minimum cycle time:
The minimum cycle time is equal to the time of the longest task.
The minimum cycle time is 50 seconds / unit.
Calculation of cycle time for the desired output:
The cycle time is calculated by dividing the operating time per day in seconds by the desired output per day.
The cycle time for the desired output is 50.4 seconds / unit.
The manager might use a cycle time of 50 seconds because it is closer to the calculated time. Also the task times are integers giving it a good chance to balance the line effectively.
c)
To determine: The minimum number of workstations for the desired output.
Introduction:
Process selection:
It is the tactical choices made by a firm in picking the kind of production procedure to be followed in the process of production. The process is selected after reviewing many numbers of criteria and constraints.
Answer to Problem 7P
Explanation of Solution
Given information:
| Task | Task time (seconds) | Immediate predecessor |
| A | 45 | Nil |
| B | 11 | A |
| C | 9 | B |
| D | 50 | Nil |
| E | 26 | D |
| F | 11 | E |
| G | 12 | C |
| H | 10 | C |
| I | 9 | F, G , H |
| J | 10 | I |
| Total | 193 |
Operating hours per day = 7
Sum of all task times = 193 seconds
Desired output per day = 500
Calculation of minimum number of workstations:
The minimum number of workstations is calculated by dividing the sum of all task times with the calculated cycle time.
The minimum number of workstations for the desired output is 4 workstations.
d)
To assign: Tasks on the basis of greatest positional weight.
Introduction:
Process selection:
It is the tactical choices made by a firm in picking the kind of production procedure to be followed in the process of production. The process is selected after reviewing many numbers of criteria and constraints.
Explanation of Solution
Given information:
| Task | Duration (minutes) | Immediate (Predecessor) |
| a | 0.1 | Nil |
| b | 0.2 | a |
| c | 0.9 | b |
| d | 0.6 | c |
| e | 0.1 | Nil |
| f | 0.2 | d, e |
| g | 0.4 | f |
| h | 0.1 | g |
| i | 0.2 | h |
| j | 0.7 | i |
| k | 0.3 | j |
| l | 0.2 | k |
Cycle time = 50 seconds
The number of following tasks, calculation of positional weight for each task is shown below.
| Task | Following tasks | Number of following tasks | Calculation of positional weight | Positional weight |
| A | B, C, G, H, I, J | 6 | 45 + 11 + 9 + 12 + 10 + 9 + 10 | 106 |
| B | C, G, H, I, J | 5 | 11 + 9 + 12 + 10 + 9 + 10 | 61 |
| C | G, H, I, J | 4 | 9 + 12 + 10 + 9 + 10 | 50 |
| D | E, F, I, J | 4 | 50 + 26 + 11 + 9 + 10 | 106 |
| E | F, I, J | 3 | 26 + 11 + 9 + 10 | 56 |
| F | I, J | 2 | 11 + 9 + 10 | 30 |
| G | I, J | 2 | 12 + 9 + 10 | 31 |
| H | I, J | 2 | 10 + 9 + 10 | 29 |
| I | J | 1 | 9 + 10 | 19 |
| J | Nil | 0 | 10 | 10 |
Assigning tasks to workstations:
| Workstation number | Eligible task | Assigned task | Task time | Unassigned cycle time | Reason |
| 50 | |||||
| 1 | A, D | A | 45 | 5 | Task 'A' has more following tasks |
| B, D | None | 5 (Idle time) | The task time is greater than the unassigned cycle time. | ||
| 50 | |||||
| 2 | B, D | D | 50 | 0 | Task 'D' has the highest positional weight |
| 50 | |||||
| 3 | B, E | B | 11 | 39 | Task 'B' has the highest positional weight |
| C, E | E | 26 | 13 | Task 'E' has the highest positional weight | |
| C, F | C | 9 | 4 | Task 'C' has the highest positional weight | |
| F, G, H | None | 4 (Idle time) | The task time is greater than the unassigned cycle time. | ||
| 50 | |||||
| 4 | F, G, H | G | 12 | 38 | Task 'G' has the highest positional weight |
| F, H | F | 11 | 27 | Task 'F' has the highest positional weight | |
| H | H | 10 | 17 | Task 'H' is the only eligible task available | |
| I | I | 9 | 8 | Task 'I' is the only eligible task available | |
| J | None | 8 (Idle time) | The task time is greater than the unassigned cycle time. | ||
| 50 | |||||
| 5 | J | J | 10 | 40 | Task 'J' is the only task remaining |
| 40 (Idle time) | All tasks completed |
Overview of tasks assignment:
| Workstation | Assigned tasks | Total cycle time used | Idle time |
| 1 | A | 45 | 5 |
| 2 | D | 50 | 0 |
| 3 | B, E, C | 46 | 4 |
| 4 | G, F, H, I | 42 | 8 |
| 5 | J | 10 | 40 |
e)
To determine: The percentage of idle time.
Introduction:
Process selection:
It is the tactical choices made by a firm in picking the kind of production procedure to be followed in the process of production. The process is selected after reviewing many numbers of criteria and constraints.
Answer to Problem 7P
Explanation of Solution
Formula to calculate percentage of idle time:
Calculation of percentage of idle time:
The percentage of idle time is 22.80%.
Want to see more full solutions like this?
Chapter 6 Solutions
Operations Management (McGraw-Hill Series in Operations and Decision Sciences)


- You are alone at home and have to prepare a bread sandwich for yourself. The following preparation activities and time taken are given in the table below: Task Description Predecessor Time (Minutes) A Purchase of bread - 20 B Take cheese and apply on bread A 5 C Get onions from freezer A 1 D Fry onions with pepper B,C 6 E Purchase sauce for bread - 15 F Toast bread B,C 4 G Assemble bread and fried onions F 2 H Arrange in plat G 1 Determine: a. While purchasing sauce, you met a friend and spoke to him for 6 minutes. Did this cause any delay in the preparation?arrow_forwardanswer the question briefly. (Engineering management) David Aquino, engineering director, started out the day uptight. His young child had the flu the night before, and he had been up all night to help. Upon arrival at his office, David had to make urgent phone calls to approve a two-week overtime work plan due to a plant fire the night before and to plan for a product committee meeting the next day to counter environmental concerns about a wastewater treatment plant.Then he spent 30 minutes reviewing the qualifications of new candidates anddecided on one. He asked for salary information and wanted to examine the offer before it was sent. He asked for further justification for the budget requested by industrial engineering for a minicomputer. Without reading it, he approved the research proposal from material engineering. He rejected an invitation to speak at a regional meeting of the Philippine Society of Mechanical Engineers by giving an untrue reason.David made a note for the United…arrow_forwardHarness International, a global wiring harness company, allows each customer to access its engineering drawings on the company's extranet, speeding up the design process for every project. Harness would consider this to be a(n) ________. A. opportunity B. resource C. capability D. competitive advantagearrow_forward
- Assume you are the owner of a construction firm with its headquarters in New Delhi. Two customers from Chennai and Himachal Pradesh have approached you for the construction of an energy-efficient structure in their respective locations. What strategy would you use to complete the projects? Additionally, create a flow chart for both projects to illustrate your design strategy and execution methods. Hint: The design must include bioclimatic architecture, a high-performance building envelope, and enough ventilation.arrow_forwardAnswer the question (Engineering management) David Aquino, engineering director, started out the day uptight. His young child had the flu the night before, and he had been up all night to help. Upon arrival at his office, David had to make urgent phone calls to approve a two-week overtime work plan due to a plant fire the night before and to plan for a product committee meeting the next day to counter environmental concerns about a wastewater treatment plant. Then he spent 30 minutes reviewing the qualifications of new candidates and decided on one. He asked for salary information and wanted to examine the offer before it was sent. He asked for further justification for the budget requested by industrial engineering for a minicomputer. Without reading it, he approved the research proposal from material engineering. He rejected an invitation to speak at a regional meeting of the Philippine Society of Mechanical Engineers by giving an untrue reason. David made a note for the United…arrow_forwardA manager wants to assign tasks to workstations as efficiently as possible and achieve an hourlyoutput of four units. The department uses a working time of 56 minutes per hour. Assign the tasksshown in the accompanying precedence diagram (times are in minutes) to workstations using thefollowing rules:a. In order of most following tasks. Tiebreaker: greatest positional weight.b. In order of greatest positional weight. Tiebreaker: most following tasks.c. What is the efficiency?arrow_forward
- A dress-making operation is being designed as an assemblyline. Table 10-22 shows the tasks that need to be performed, theirtask times, and preceding tasks. If the goal is to produce 30 dressesper hour, answer the questions that follow the table. (a) Compute the cycle time.(b) Which task is the bottleneck?(c) What is the maximum output for this line?(d) Compute the theoretical minimum number of stations.(e) Assign work elements to stations, using the longest tasktime rule.(f) Compute the effi ciency and balance delay of yourassignment.arrow_forwardSince Jack believes that Work Center 3 is his bottleneck, hehas asked you to do the following:(a) Calculate the percentage of planned output needed tocomplete the planned inputs (planned input 1 backlog/planned output) at Work Center 3.(b) Calculate the percentage of planned input that actuallyhappened (actual input 1 backlog/planned input 1backlog).(c) Calculate the percentage of available output that wasactually accomplished (actual output/planned output) atWork Center 3.(d) Given your results, do you believe that Jack is correct inassuming that Work Center 3 is his bottleneck? Justifyyour answer.arrow_forwardSYSTEM ANALYSIS AND DESIGN BASED ON THE TABLE GIVEN 1. To draw a Gantt chart, identify symbols that should be included to represent: a. summary task b. milestone c. critical task 2. if activity C is lecture, activity B is exam and activity D is teachning, produce a description of these activities according to: a. finish to start task pattern b. start to start task patternarrow_forward
- Classify each of the following as nominal, ordinal, interval, or ratio data and explain. a. the time required to produce each car on an assembly line. b. the number of liters of water a family drinks in a month. c. the ranking of four student projects in your class after they have been designated as excellent, good, satisfactory, and poor. d. the telephone area code of clients in India. e. Explain the four groups of data in detail.arrow_forwardJamison Day Consul tants has been entrusted with thetask of evaluating a business plan that has been divided into foursections- marketing, finance, operations, and human resources.Chris, Steve, Juana, and Rebecca form the evaluation team. Each of them has expertise in a certain field and tends to finish thatsection faster. The estimated times taken by each team memberfor each section have been outlined in the following table. Furtherinformation states that each of these individuals is paid $60/hour.a) Assign each member to a different section such that JamisonConsultants's overall cost is minimized.b) What is the total cost of these assignments?arrow_forward10. The following precedence network is used for assembling a product. You have been asked to achieve an output of 240 units per eight-hour day. All times in this network are in minutes. Balance the line using the following rule: assign tasks to workstations on the basis of most following tasks (Rule 1). Use greatest positional weight (Rule 2) as a tiebreaker. What is the first activity assigned to workstation 3? b c d f e aarrow_forward
 Practical Management ScienceOperations ManagementISBN:9781337406659Author:WINSTON, Wayne L.Publisher:Cengage,
 Operations ManagementOperations ManagementISBN:9781259667473Author:William J StevensonPublisher:McGraw-Hill Education
 Operations and Supply Chain Management (Mcgraw-hi...Operations ManagementISBN:9781259666100Author:F. Robert Jacobs, Richard B ChasePublisher:McGraw-Hill Education
 Purchasing and Supply Chain ManagementOperations ManagementISBN:9781285869681Author:Robert M. Monczka, Robert B. Handfield, Larry C. Giunipero, James L. PattersonPublisher:Cengage Learning
 Production and Operations Analysis, Seventh Editi...Operations ManagementISBN:9781478623069Author:Steven Nahmias, Tava Lennon OlsenPublisher:Waveland Press, Inc.