
Concept explainers
Videos
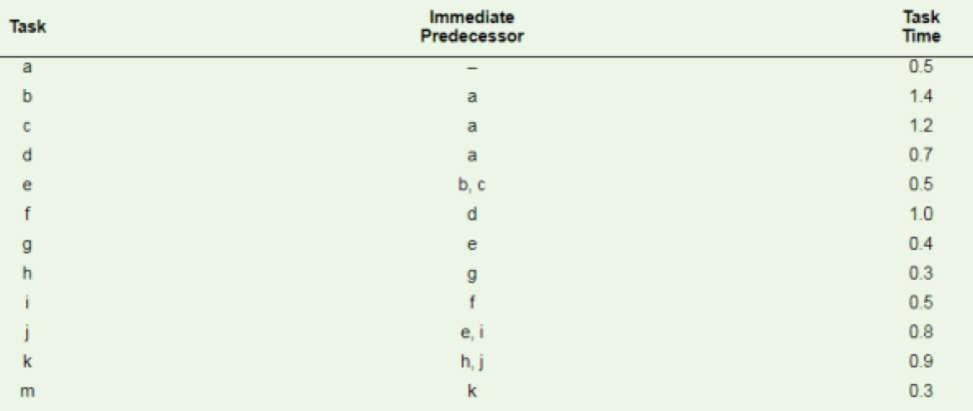
A shop works a 400-minute day. The manager of the shop wants an output of 200 units per day for the assembly line that has the elemental tasks shown in the table. Do the following:
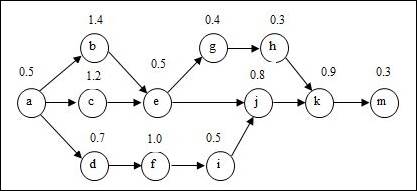
a. Construct the precedence diagram.
b. Assign tasks according to the most following tasks rule. Break ties with the greatest positional weight rule.
c. Assign tasks according to the greatest positional weight rule. Break ties with the most following tasks rule.
d. Compute the balance delay for each rule. Which one yields the better set of assignments in this instance?
a)
To draw: The precedence diagram.
Introduction:
Process selection:
It is the tactical choices made by a firm in picking the kind of production procedure to be followed in the process of production. The process is selected after reviewing many numbers of criteria and constraints.
Answer to Problem 8P
Precedence diagram:
Explanation of Solution
Given information:
| Task | Task time (Minutes) | Immediate predecessor |
| a | 0.5 | Nil |
| b | 1.4 | a |
| c | 1.2 | a |
| d | 0.7 | a |
| e | 0.5 | b, c |
| f | 1 | d |
| g | 0.4 | e |
| h | 0.3 | g |
| i | 0.5 | f |
| j | 0.8 | e, i |
| k | 0.9 | h, j |
| m | 0.3 | k |
Number of minutes per day = 400
Desired output per day = 200 units
Precedence diagram:
The precedence diagram is drawn circles and arrows. The tasks are represented in circles and weights for each task are represented outside the circle. The arrows are represented to show which task is preceding the other task and so on.
b)
To assign: Tasks on the basis of most following tasks.
Introduction:
Process selection:
It is the tactical choices made by a firm in picking the kind of production procedure to be followed in the process of production. The process is selected after reviewing many numbers of criteria and constraints.
Explanation of Solution
Given information:
| Task | Task time (Minutes) | Immediate predecessor |
| a | 0.5 | Nil |
| b | 1.4 | a |
| c | 1.2 | a |
| d | 0.7 | a |
| e | 0.5 | b, c |
| f | 1 | d |
| g | 0.4 | e |
| h | 0.3 | g |
| i | 0.5 | f |
| j | 0.8 | e, i |
| k | 0.9 | h, j |
| m | 0.3 | k |
Number of minutes per day = 400
Desired output per day = 200 units
Calculation of cycle time:
The cycle time is calculated by dividing the operating time per day by the desired output per day.
The number of following tasks, calculation of positional weight for each task is shown below.
| Task | Following tasks | Number of following tasks | Calculation of positional weight | Positional weight |
| a | b, c, d, e, f, g, h, i, j, k, m | 11 | 0.5 + 1.4 + 1.2 + 0.7 + 0.5 + 1 + 0.4 + 0.3 + 0.5 + 0.8 + 0.9 + 0.3 | 8.5 |
| b | e, g, h, j, k, m | 6 | 1.4 + 0.5 + 0.4 + 0.3 + 0.8 + 0.9 + 0.3 | 4.6 |
| c | e, g, h, j, k, m | 6 | 1.2 + 0.5 + 0.4 + 0.3 + 0.8 + 0.9 + 0.3 | 4.4 |
| d | f, i, j, k, m | 5 | 0.7 + 1 + 0.5 + 0.8 + 0.9 + 0.3 | 4.2 |
| e | g, h, j, k, m | 5 | 0.5 + 0.4 + 0.3 + 0.8+ 0.9 + 0.3 | 3.2 |
| f | i, j, k, m | 4 | 1 + 0.5 + 0.8 + 0.9 + 0.3 | 3.5 |
| g | h, k, m | 3 | 0.4 + 0.3 + 0.9 + 0.3 | 1.9 |
| h | k, m | 2 | 0.3 + 0.9 + 0.3 | 1.5 |
| i | j, k, m | 3 | 0.5 + 0.8 0.9 + 0.3 | 2.5 |
| j | k, m | 2 | 0.8 + 0.9 + 0.3 | 2 |
| k | m | 1 | 0.9 + 0.3 | 1.2 |
| m | Nil | 0 | 0.3 | 0.3 |
Assigning tasks to workstations:
| Workstation number | Eligible task | Assigned task | Task time | Unassigned cycle time | Reason |
| 2 | |||||
| 1 | a | a | 0.5 | 1.5 | Task 'a' is the only eligible task available |
| b, c, d | b | 1.4 | 0.1 | Task 'b' has the highest positional weight | |
| c, d | None | 0.1 (Idle time) | The task time is greater than the unassigned cycle time. | ||
| 2 | |||||
| 2 | c, d | c | 1.2 | 0.8 | Task 'c' has more following tasks |
| d, e | d | 0.7 | 0.1 | Task 'd' has the highest positional weight | |
| e, f | None | 0.1 (Idle time) | The task time is greater than the unassigned cycle time. | ||
| 2 | |||||
| 3 | e, f | e | 0.5 | 1.5 | Task 'e' has more following tasks |
| f, g | f | 1 | 0.5 | Task 'f' has more following tasks | |
| g, i | i | 0.5 | 0 | Task 'i' has the highest positional weight | |
| 2 | |||||
| 4 | g, j | g | 0.4 | 1.6 | Task 'g' has more following tasks |
| h, j | j | 0.8 | 0.8 | Task 'j' has the highest positional weight | |
| h | h | 0.3 | 0.5 | Task 'h' is the only eligible task available | |
| k | None | 0.5 (Idle time) | The task time is greater than the unassigned cycle time. | ||
| 2 | |||||
| 5 | k | k | 0.9 | 1.1 | Task 'k' is the only eligible task available |
| m | m | 0.3 | 0.8 | Task 'm' is the only task remaining | |
| 0.8 (Idle time) | All tasks completed |
Overview of tasks assignment:
| Workstation | Assigned tasks | Total cycle time used | Idle time |
| 1 | a, b | 1.9 | 0.1 |
| 2 | c, d | 1.9 | 0.1 |
| 3 | e, f, i | 2 | 0 |
| 4 | g, j, h | 1.5 | 0.5 |
| 5 | k, m | 1.2 | 0.8 |
c)
To assign: Tasks on the basis of greatest positional weight.
Introduction:
Process selection:
It is the tactical choices made by a firm in picking the kind of production procedure to be followed in the process of production. The process is selected after reviewing many numbers of criteria and constraints.
Explanation of Solution
Given information:
| Task | Task time (Minutes) | Immediate predecessor |
| a | 0.5 | Nil |
| b | 1.4 | a |
| c | 1.2 | a |
| d | 0.7 | a |
| e | 0.5 | b, c |
| f | 1 | d |
| g | 0.4 | e |
| h | 0.3 | g |
| i | 0.5 | f |
| j | 0.8 | e, i |
| k | 0.9 | h, j |
| m | 0.3 | k |
Number of minutes per day = 400
Desired output per day = 200 units
Calculation of cycle time:
The cycle time is calculated by dividing the operating time per day by the desired output per day.
The number of following tasks, calculation of positional weight for each task is shown below.
| Task | Following tasks | Number of following tasks | Calculation of positional weight | Positional weight |
| a | b, c, d, e, f, g, h, i, j, k, m | 11 | 0.5 + 1.4 + 1.2 + 0.7 + 0.5 + 1 + 0.4 + 0.3 + 0.5 + 0.8 + 0.9 + 0.3 | 8.5 |
| b | e, g, h, j, k, m | 6 | 1.4 + 0.5 + 0.4 + 0.3 + 0.8 + 0.9 + 0.3 | 4.6 |
| c | e, g, h, j, k, m | 6 | 1.2 + 0.5 + 0.4 + 0.3 + 0.8 + 0.9 + 0.3 | 4.4 |
| d | f, i, j, k, m | 5 | 0.7 + 1 + 0.5 + 0.8 + 0.9 + 0.3 | 4.2 |
| e | g, h, j, k, m | 5 | 0.5 + 0.4 + 0.3 + 0.8+ 0.9 + 0.3 | 3.2 |
| f | i, j, k, m | 4 | 1 + 0.5 + 0.8 + 0.9 + 0.3 | 3.5 |
| g | h, k, m | 3 | 0.4 + 0.3 + 0.9 + 0.3 | 1.9 |
| h | k, m | 2 | 0.3 + 0.9 + 0.3 | 1.5 |
| i | j, k, m | 3 | 0.5 + 0.8 0.9 + 0.3 | 2.5 |
| j | k, m | 2 | 0.8 + 0.9 + 0.3 | 2 |
| k | m | 1 | 0.9 + 0.3 | 1.2 |
| m | Nil | 0 | 0.3 | 0.3 |
Assigning tasks to workstations:
| Workstation number | Eligible task | Assigned task | Task time | Unassigned cycle time | Reason |
| 2 | |||||
| 1 | a | a | 0.5 | 1.5 | Task 'a' is the only eligible task available |
| b, c, d | b | 1.4 | 0.1 | Task 'b' has the highest positional weight | |
| c, d | None | 0.1 (Idle time) | The task time is greater than the unassigned cycle time. | ||
| 2 | |||||
| 2 | c, d | c | 1.2 | 0.8 | Task 'c' has the highest positional weight |
| d, e | d | 0.7 | 0.1 | Task 'd' has the highest positional weight | |
| e, f | None | 0.1 (Idle time) | The task time is greater than the unassigned cycle time. | ||
| 2 | |||||
| 3 | e, f | f | 1 | 1 | Task 'f' has the highest positional weight |
| e, i | e | 0.5 | 0.5 | Task 'e' has the highest positional weight | |
| g, i | i | 0.5 | 0 | Task 'g' has the highest positional weight | |
| 2 | |||||
| 4 | g, j | j | 0.8 | 1.2 | Task 'j' has the highest positional weight |
| g | g | 0.4 | 0.8 | Task 'g' is the only eligible task available | |
| h | h | 0.3 | 0.5 | Task 'h' is the only eligible task available | |
| k | None | 0.5 (Idle time) | The task time is greater than the unassigned cycle time. | ||
| 2 | |||||
| 5 | k | k | 0.9 | 1.1 | Task 'k' is the only eligible task available |
| m | m | 0.3 | 0.8 | Task 'm' is the only task remaining | |
| 0.8 (Idle time) | All tasks completed |
Overview of tasks assignment:
| Workstation | Assigned tasks | Total cycle time used | Idle time |
| 1 | a, b | 1.9 | 0.1 |
| 2 | c, d | 1.9 | 0.1 |
| 3 | f, e, i | 2 | 0 |
| 4 | j, g, h | 1.5 | 0.5 |
| 5 | k, m | 1.2 | 0.8 |
d)
To determine: The balance delay.
Introduction:
Process selection:
It is the tactical choices made by a firm in picking the kind of production procedure to be followed in the process of production. The process is selected after reviewing many numbers of criteria and constraints.
Answer to Problem 8P
Explanation of Solution
The balance delay is also known as the percentage of idle time.
Formula to calculate percentage of idle time:
Calculation of percentage of idle time:
Most following tasks:
The percentage of idle time is 15%.
Greatest positional weight:
The percentage of idle time is 15%.
The balance delay for most following tasks and greatest positional weight rule is 15%.
Want to see more full solutions like this?
Chapter 6 Solutions
OPERATIONS MANAGEMENT -ACCESS


- A shop works a 400-minute day. The manager of the shop wants an output of 200 units per day for the assembly line that has the elemental tasks shown in the table. Do the following: b.) Assign tasks according to the most following tasks rule. Break ties with the greatest positional weight rule. c.) Assign tasks according to the greatest positional weight rule. Break ties with the most following tasks rule. d.) Compute the efficiency level for each rule. Which one yields the better set of assignments in this instance?arrow_forwardAn assembly line is to operate eight hours per day with a desired output of 200 units per day. The following table contains information on this product’s task times and precedence relationships: TASK TASK TIME(SECONDS) IMMEDIATEPREDECESSOR A 60 — B 60 A C 50 A D 70 A E 30 B, C F 110 C, D G 70 E, F H 70 G b. What is the required workstation cycle time to meet the desired output rate? (Round your answer to the nearest whole number.) c. Balance this line using the longest task time. (Leave no cells blank - be certain to enter "0" wherever required.) d. What is the efficiency of your line balance, assuming it is running at the cycle time determined in part b? (Round your answer to 1 decimal place.)arrow_forwardThe preinduction physical examination given by the i U.S. Army involves the following seven activities: These activities can be performed in any order, with two exceptions:Medical history must be taken first, and Exit medical evaluation is last. At present, there are three paramedics and two physicians on duty during each shift. Only physicians can performexit evaluations and conduct psychological in terviews. Other activities can be carried out by either physicians or paramedics.a) Develop a layout and balance the line.b) How many people can be processed per hour?c) Which activity accounts for the current bottleneck?d) What is the total idle time per cycle?e) If one more physician and one more paramedic can be placed on duty, how would you redraw the layout? What is the new throughput?arrow_forward
- An assembly line is to operate eight hours per day with a desired output of 240 units perday. The following table contains information on this product’s task times and precedencerelationships: Task Task Time (Seconds) Immediate Predecessor A 60 — B 80 A C 20 A D 50 A E 90…arrow_forward(3) The following information is given about an assembly line. The desired output rate is 360 units per 8-hour day. Task Time (sec) Immediate Predecessor(s) A 30 - B 25 A C 40 A, B D 45 B E 25 B F 28 C, E G 16 D H 40 F, G a. How many stations are required for the most efficient balance you can achieve? b. Balance the line according to the most following tasks rule. c. What is the idle time per unit for your solution? d. Identify the bottleneck for your solution.arrow_forwardAn assembly line must be designed to produce 50 packagesper hour. Th e following data in Table 10-17 give the necessaryinformation. (a) Draw a precedence diagram.(b) Compute the cycle time (in seconds) to achieve thedesired output rate.(c) What is the theoretical minimum number of stations?(d) Which work element should be assigned to whichworkstation?(e) What are the resulting effi ciency and balance delaypercentages?arrow_forward
- An assembly line is to be designed to operate 7½ hours per day and supply a steady demand of 300 units per day. Here are the tasks and their performance times: TASK PRECEDING TASKS PERFORMANCETIME (SECONDS) A — 70 B — 40 C — 45 D A 10 E B 30 F C 20 G D 60 H E 50 I F 15 J G 25 K H, I 20 L J, K 25 What is the workstation cycle time required to meet the desired output rate? What is the theoretical minimum number of workstations required to meet the desired output rate? Note: Round up your answer to the next whole number. Assign tasks to workstations using the longest operating time. What is the efficiency of your line balance, assuming it is running at the cycle time determined in part b? Note: Round your answer to 1 decimal place. Suppose demand increases by 10 percent. How would you react to this? Assume that you can operate only 71/2 hours per day. Note: Round your answer for cycle time down to the nearest whole number. Round your…arrow_forwardAn assembly line is to operate eight hours per day with a desired output of 250 units per day. The following table contains information on this product’s task times and precedence relationships: TASK TASK TIME (SECONDS) IMMEDIATE PREDECESSOR A 50 — B 20 A C 25 A D 35 A E 60 B, C F 60 C, D G 50 E, F H 90 G What is the required workstation cycle time to meet the desired output rate? Note: Round your answer to the nearest whole number. Balance this line using the longest task time. Note: Leave no cells blank - be certain to enter "0" wherever required. What is the efficiency of your line balance, assuming it is running at the cycle time determined in part b? Note: Round your answer to 1 decimal place.arrow_forwardFrancis Johnson’s plant needs to design an efficient assembly line to make a new product. The assembly line needs to produce 15 units per hour, and there is room for only four workstations. The tasks and the order in which they must be performed are shown in the following table. Tasks cannot be split, and it would be too expensive to duplicate any task. TASK TASK TIME (MINUTES) IMMEDIATE PREDECESSOR A 1 — B 2 — C 3 — D 1 A, B, C E 3 C F 2 E G 3 E What is the workstation cycle time required to produce 15 units per hour? Note: Round your answer to 1 decimal place. Balance the line to use the fewest possible workstations to meet the cycle time found in part (b). Use whatever method you feel is appropriate. What is the efficiency of your line balance, assuming the line operates at the cycle time from part (b)? Note: Round your answer to 1 decimal place.arrow_forward
- A paced assembly line has been devised to manufacture calculators, as the following data show: LOADING... Station Work Element Assigned Work Element Time (min) S1 A 4.0 S2 D, E 0.9, 1.5 S3 C 5.0 S4 B, F, G 1.1, 1.0, 1.3 S5 H, I, J 1.1, 0.5, 1.8 S6 K 4.0 a. What is the maximum hourly output rate from this line? (Hint: The line can only go as fast as its slowest workstation.) The maximum hourly output rate is nothing calculators per hour. (Enter your response as an integer.) B. What cycle time corresponds to this maximum output rate? C. If a worker is at each station and the line operates at this maximum output rate, how much idle time is lost during each? 10-hour shift? D. What is the line's efficiency?arrow_forwardAn assembly line must be designed to produce 40 containers per hour. The following data give the necessary information Table 1 TASK IMMEDIATE PREDECESSOR TASK TIME (sec) A None 60 B A 12 C B 35 D A 55 E D 10 F E 50 G F, C 5 Draw the precedence diagram. ii. Compute the cycle time (in seconds) to achieve the desired output rate. iii. What is the theoretical minimum number of stations? iv. Assign the tasks to workstation? v. What is the efficiency of the line? PLEASE ANSWER THE FOLLOWING QUESTIONS: iV, & v.arrow_forwardKlassen Toy Company, Inc., assembles two parts(parts I and 2): Part I is first processed at workstation A for15 minutes per unit and then processed at workstation B for330 PART 2 DESIGNING OPERATIONS10 minutes per unit. Part 2 is simultaneously processed at workstationC for 20 minutes per unit. Workstations B and C feed theparts to an assembler at workstation D, where the two parts areassembled. The time at workstation Dis 15 minutes.a) What is the bottleneck of this process?b) What is the hourly capacity of the process?arrow_forward
 Practical Management ScienceOperations ManagementISBN:9781337406659Author:WINSTON, Wayne L.Publisher:Cengage,
 Operations ManagementOperations ManagementISBN:9781259667473Author:William J StevensonPublisher:McGraw-Hill Education
 Operations and Supply Chain Management (Mcgraw-hi...Operations ManagementISBN:9781259666100Author:F. Robert Jacobs, Richard B ChasePublisher:McGraw-Hill Education
 Purchasing and Supply Chain ManagementOperations ManagementISBN:9781285869681Author:Robert M. Monczka, Robert B. Handfield, Larry C. Giunipero, James L. PattersonPublisher:Cengage Learning
 Production and Operations Analysis, Seventh Editi...Operations ManagementISBN:9781478623069Author:Steven Nahmias, Tava Lennon OlsenPublisher:Waveland Press, Inc.