
Videos
To graph: the given function and to compare with the parent function and then to
describe the domain and range.
Explanation of Solution
Given information:
The given equation is
Concept used:
Domain is the set of input values for which the function is defined.
Range is the set of output values for input values which are in domain.
Calculation:
Make a table of values for
The graph of
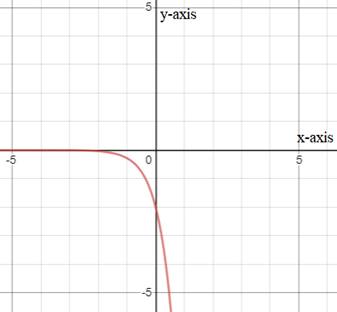
The parent function of given function is
The graph of
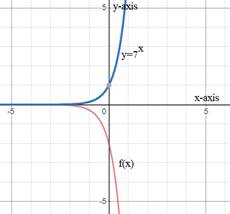
Hence,
The graph of
of the graph of the parent function across x-axis..
Domain is
Chapter 6 Solutions
BIG IDEAS MATH Integrated Math 1: Student Edition 2016


 Discrete Mathematics and Its Applications ( 8th I...MathISBN:9781259676512Author:Kenneth H RosenPublisher:McGraw-Hill Education
 Mathematics for Elementary Teachers with Activiti...MathISBN:9780134392790Author:Beckmann, SybillaPublisher:PEARSON
 Thinking Mathematically (7th Edition)MathISBN:9780134683713Author:Robert F. BlitzerPublisher:PEARSON
 Discrete Mathematics With ApplicationsMathISBN:9781337694193Author:EPP, Susanna S.Publisher:Cengage Learning,
 Pathways To Math Literacy (looseleaf)MathISBN:9781259985607Author:David Sobecki Professor, Brian A. MercerPublisher:McGraw-Hill Education