
Videos
(a)
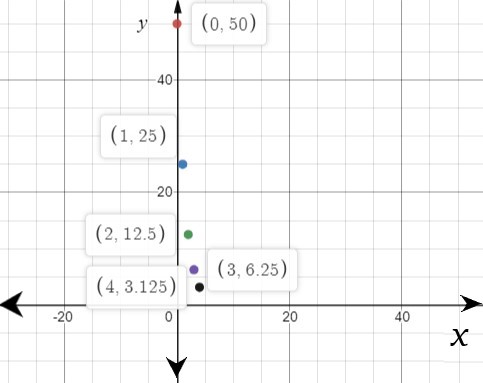
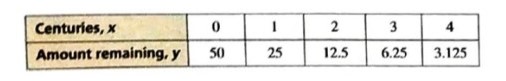
To plot the points given in table

Given:
The table showing the amount y (in grams) of an element remaining in a jar after x centuries

Graph:
Graph of points plotted is as follows:
(b)
To tell whether the data can be modelled by a linear or an exponential function, then write the function
Data can be modelled by exponential function
Required exponential function is
Given:
The table showing the amount y (in grams) of an element remaining in a jar after x centuries

Concept Used:
A linear function is a function whose graph is a straight line
An exponential function has a non linear graph.
It is of the form
Calculation:
From graph it is clear that it is a non linear graph.
Hence,
Given function must be an exponential function
First data gives
This means that if the function is exponential then it must be
(Because then only
Now for same data
Conclusion:
Therefore,
Required exponential function is
(c)
To find how much element remains after 600 years
Quantity (in grams) of remaining element after 600 years = (
Given:
x=600 years
Concept Used:
Put x=600 in
Calculation:
Conclusion:
Quantity (in grams) of remaining element after 600 years = (
Chapter 6 Solutions
BIG IDEAS MATH Integrated Math 1: Student Edition 2016


 Discrete Mathematics and Its Applications ( 8th I...MathISBN:9781259676512Author:Kenneth H RosenPublisher:McGraw-Hill Education
 Mathematics for Elementary Teachers with Activiti...MathISBN:9780134392790Author:Beckmann, SybillaPublisher:PEARSON
 Thinking Mathematically (7th Edition)MathISBN:9780134683713Author:Robert F. BlitzerPublisher:PEARSON
 Discrete Mathematics With ApplicationsMathISBN:9781337694193Author:EPP, Susanna S.Publisher:Cengage Learning,
 Pathways To Math Literacy (looseleaf)MathISBN:9781259985607Author:David Sobecki Professor, Brian A. MercerPublisher:McGraw-Hill Education