
Videos
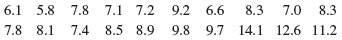
The article from which the data in Exercise 1 was extracted also gave the accompanying strength observations for cylinders:
Prior to obtaining data, denote the beam strengths by X1,..., Xm and the cylinder strengths by Y1, ..., Yn. Suppose that the Xi’s constitute a random sample from a distribution with mean μ1 and standard deviation σ1 and that the Yi’s form a random sample (independent of the Xi’s) from another distribution with mean μ2 and standard deviation σ2.
- a. Use rules of
expected value to show that - b. Use rules of variance from Chapter 5 to obtain an expression for the variance and standard deviation (standard error) of the estimator in part (a), and then compute the estimated standard error.
- c. Calculate a point estimate of the ratio σ1/σ2 of the two standard deviations.
- d. Suppose a single beam and a single cylinder are randomly selected. Calculate a point estimate of the variance of the difference X – Y between beam strength and cylinder strength.
a.
Show that
Find the point estimate of the population mean for the data.
Answer to Problem 4E
A point estimate of the population mean for the data is –0.434.
Explanation of Solution
Given info:
Reference- Exercise 1: The data gives 20 sample observations for cylinders. The sample beam strengths are denoted by
Calculation:
The sample means for beam strengths and cylinder strengths are respectively
An estimator is considered as an unbiased estimator, if and only if the expected value of the estimator is equal to the population characteristic it is estimating.
It is known that the sample mean is an unbiased estimator of the population mean. As a result,
Consider the expectation of
Hence,
From Exercise 1,
Now, sample mean,
For the data on cylinder strengths,
The following table shows the calculation for
| 6.1 |
| 5.8 |
| 7.8 |
| 7.1 |
| 7.2 |
| 9.2 |
| 6.6 |
| 8.3 |
| 7.0 |
| 8.3 |
| 7.8 |
| 8.1 |
| 7.4 |
| 8.5 |
| 8.9 |
| 9.8 |
| 9.7 |
| 14.1 |
| 12.6 |
| 11.2 |
Thus,
Hence, a point estimate of the population mean for the data is:
b.
Find an expression for the variance and standard deviation (standard error) of the estimator in part a.
Calculate the estimated standard error.
Answer to Problem 4E
An expression for the variance of the estimator in part a is
An expression for the standard deviation (standard error) of the estimator in part a is
The estimated standard error is 0.5691.
Explanation of Solution
Calculation:
Consider the variance of the estimator in part a, that is,
For a sample of size m, the variance of the mean
where
Thus,
Hence, the variance of the estimator in part a is:
The corresponding standard deviation is:
Thus, an expression for the standard deviation (standard error) of the estimator in part a is:
For a sample of size m from a normally distributed random variable, the standard error of the mean
where s is the sample standard deviation of the observations of X. A point estimate of the population standard deviation is the sample standard deviation.
From Exercise 1,
Now, sample variance is:
For the data,
The following table shows the calculation for
| 6.1 | 37.21 |
| 5.8 | 33.64 |
| 7.8 | 60.84 |
| 7.1 | 50.41 |
| 7.2 | 51.84 |
| 9.2 | 84.64 |
| 6.6 | 43.56 |
| 8.3 | 68.89 |
| 7.0 | 49.0 |
| 8.3 | 68.89 |
| 7.8 | 60.84 |
| 8.1 | 65.61 |
| 7.4 | 54.76 |
| 8.5 | 72.25 |
| 8.9 | 79.21 |
| 9.8 | 96.04 |
| 9.7 | 94.09 |
| 14.1 | 198.81 |
| 12.6 | 158.76 |
| 11.2 | 125.44 |
| Total |
Thus,
Thus, the estimated standard error is:
c.
Find a point estimate of the ratio
State the estimator used.
Answer to Problem 4E
A point estimate of the ratio
Explanation of Solution
Calculation:
A point estimate of the population standard deviation is the sample standard deviation. As a result, a point estimate of the ratio
From part b,
Hence, a point estimate of the ratio
d.
Find a point estimate of the variance of the difference
Answer to Problem 4E
A point estimate of the variance of the difference
Explanation of Solution
Calculation:
For independent random variables X and Y, it is known that:
Here,
A point estimate of the variance of X is
Thus, a point estimate of the variance of the difference
Want to see more full solutions like this?
Chapter 6 Solutions
Bundle: Probability and Statistics for Engineering and the Sciences, 9th + WebAssign Printed Access Card for Devore's Probability and Statistics for ... and the Sciences, 9th Edition, Single-Term


- Suppose X, Y, Z are iid observations from a Poisson distribution with parameter λ, which is unknown. Consider the 3 estimators T1 = X + Y − Z, T2 = 2X + Y + Z 4 , T3 = 3X + Y + Z 5 . (a) Which among the above estimators are unbiased? (b) Among the class of unbiased estimators, which has the minimum variance?arrow_forwardA snack food manufacturer estimates that the variance of the number of grams of carbohydrates in servings of its tortilla chips is 1.34. A dietician is asked to test this claim and finds that a random sample of 16 servings has a variance of 1.22. At α=0.05, is there enough evidence to reject the manufacturer's claim? Assume the population is normally distributed. Complete parts (a) through (e) below.arrow_forwardRecently, the annual number of driver deaths per 100,000 for the selected age groups was as follows: Age Number of Driver Deaths per 100,000 16–19 38 20–24 36 25–34 24 35–54 20 55–74 18 75+ 28 Use the 4 steps of hypothesis testing to see if the prediction is significant with a criteria of alpha=.05 on the following data For each age group, pick the midpoint of the interval for the X value. (For the 75+ group, use 80.)arrow_forward
- An electrical engineer wishes to determine if, among two specific municipal buildings in town, Building “North” and Building “South”, whether the tensile strength of pipes (in psi) is not the same in each of these two buildings. A sample of pipes was chosen at random from both Building “North” and Building “South”, respectively. Using α = 0.05, which of the following statistical test, or parameter, would be best for determining whether tensile strength of pipes (in psi) is not the same in each of these two buildings? (Assume all statistical assumptions met.) a) Binomial Distribution b) Population Difference in Means (i.e., Unpaired Data) c) The Chi-Squared Test of Independence d) Population Mean Difference (i.e., Paired Data)arrow_forwardWhich of the following can cause the usual OLS t statistics to be invalid (that is, not to have t distributions under H0)?(i) Heteroskedasticity.(ii) A sample correlation coefficient of .95 between two independent variables that are in the model.(iii) Omitting an important explanatory variable.arrow_forwardA snack food manufacturer estimates that the variance of the number of grams of carbohydrates in servings of its tortilla chips is 1.33. A dietician is asked to test this claim and finds that a random sample of 24 servings has a variance of 1.37. At α=0.01, is there enough evidence to reject the manufacturer's claim? Assume the population is normally distributed. Complete parts (a) through (e) below. (a) Write the claim mathematically and identify H0 and Ha. A. H0: σ2≤1.33 (Claim) Ha: σ2>1.33 B. H0: σ2≠1.33 Ha: σ2=1.33 (Claim) C. H0: σ2≥1.33 Ha: σ2<1.33 (Claim) D. H0: σ2=1.33 (Claim) Ha: σ2≠1.33 (b) Find the critical value(s) and identify the rejection region(s). The critical value(s) is(are) enter your response here. (Round to two decimal places as needed. Use a comma to separate answers as needed.) Choose the correct statement below and fill in the corresponding answer boxes. A. The…arrow_forward
- The test statistic of z = 1.42 is obtained when testing the claim that p>0.1. A.identify the phyothesis test as being two-tailed, left-tailed, or right-tailed. B.find the p-value. C. Using a significance level of o=0.05, should we reject H0 or should we fail to reject H0?arrow_forwardThe desired percentage of SiO2 in a certain type of aluminous cement is 5.5. To test whether the true average percentage is 5.5 for a particular production facility, 16 independently obtained samples are analyzed. Suppose that the percentage of SiO2 in a sample is normally distributed with ? = 0.32 and that x = 5.21. (Use ? = 0.05.) (a) Does this indicate conclusively that the true average percentage differs from 5.5?State the appropriate null and alternative hypotheses. H0: ? = 5.5Ha: ? ≠ 5.5H0: ? = 5.5Ha: ? ≥ 5.5 H0: ? = 5.5Ha: ? < 5.5H0: ? = 5.5Ha: ? > 5.5 Calculate the test statistic and determine the P-value. (Round your test statistic to two decimal places and your P-value to four decimal places.) z = P-value = State the conclusion in the problem context. Do not reject the null hypothesis. There is sufficient evidence to conclude that the true average percentage differs from the desired percentage.Reject the null hypothesis. There is sufficient evidence…arrow_forwardAssume that you have a sample of n1=7 , with the sample mean X1=44 , and a sample standard deviation of S1=6 , and you have an independent sample of n2=6 from another population with a sample mean of X2=32 and the sample standard deviation S2=5 . Assuming the population variances are equal, at the 0.01 level of significance, is there evidence that μ1>μ2?arrow_forward
- To test H0: σ=4.5 versus H1: σ≠4.5, a random sample of size n=14 is obtained from a population that is known to be normally distributed. (a) If the sample standard deviation is determined to be s=6.7, compute the test statistic. (b) If the researcher decides to test this hypothesis at the α=0.10 level of significance, determine the P-value. (c) Will the researcher reject the null hypothesis?arrow_forwardA chi-squared random variable with ν > 0 degrees of freedom (χv2) has mgf M(t) = (1 − 2t) −ν/2 . Given that Z2 ∼ χ21, derive the mean and variance of Z2 using M(t). Confirm these results using the mgf of Z, namely MZ(t) = e1/2t2 .arrow_forwardLet the following simple random sample following:1. Binomial pmf. (11, ¾);2. Uniform pmf;3. Uniform pdf (0, a);4. Exponential pdf with (µ) .Find the corresponding pmf/pdf of Y1 , Y4 , Y7 and F(Yi) wherearrow_forward
 MATLAB: An Introduction with ApplicationsStatisticsISBN:9781119256830Author:Amos GilatPublisher:John Wiley & Sons Inc
 Probability and Statistics for Engineering and th...StatisticsISBN:9781305251809Author:Jay L. DevorePublisher:Cengage Learning
 Statistics for The Behavioral Sciences (MindTap C...StatisticsISBN:9781305504912Author:Frederick J Gravetter, Larry B. WallnauPublisher:Cengage Learning
 Elementary Statistics: Picturing the World (7th E...StatisticsISBN:9780134683416Author:Ron Larson, Betsy FarberPublisher:PEARSON
 The Basic Practice of StatisticsStatisticsISBN:9781319042578Author:David S. Moore, William I. Notz, Michael A. FlignerPublisher:W. H. Freeman
 Introduction to the Practice of StatisticsStatisticsISBN:9781319013387Author:David S. Moore, George P. McCabe, Bruce A. CraigPublisher:W. H. Freeman