Concept explainers
Videos
The bar graph shows the estimated number of calories per day needed to maintain energy balance for various gender and age groups for sedentary lifestyles. (Sedentary means a lifestyle that includes only the light physical activity associated with typical day-to-day life.) 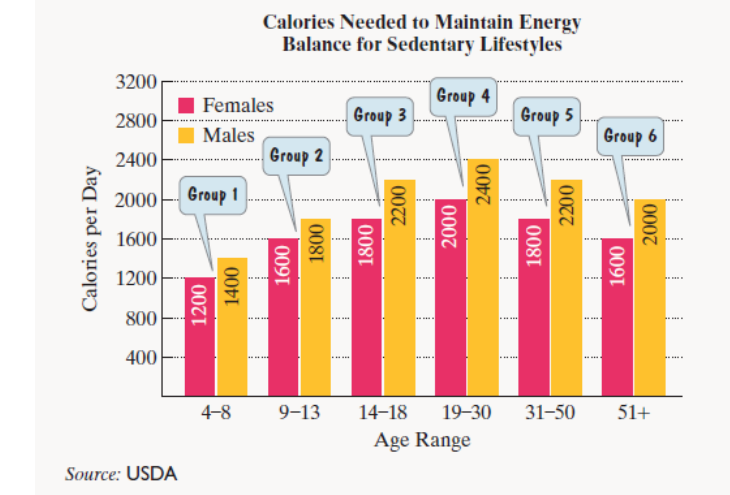 Use the appropriate information displayed by the graph to solve Exercises 69-70.
The mathematical model
Want to see the full answer?
Check out a sample textbook solution
Chapter 6 Solutions
EBK THINKING MATHEMATICALLY
Additional Math Textbook Solutions
Mathematical Ideas (13th Edition) - Standalone book
A Problem Solving Approach to Mathematics for Elementary School Teachers (12th Edition)
Finite Mathematics (11th Edition)
Using and Understanding Mathematics: A Quantitative Reasoning Approach (6th Edition)
Algebra and Trigonometry: Graphs and Models (6th Edition)
Differential Equations: An Introduction to Modern Methods and Applications


- Graph 9x2+16y2=144.arrow_forwardI am really struggling with 1-23arrow_forwardThe bar graph shows discretionary spending by full and part-time college students in some country from 2007 through 2013. The data in the graph can be modeled by the formula D=1.2x +1.6(x+40), where D represents discretionary spending among students, in billions of dollars, x years after 2007. According to the formula, how much money did college students spend in 2007? Does the model underestimate or overestimate the amount of discretionary spending displayed by the bar graph? By how much? Discretionary Spending Among Students $140- $120- 115 S100- 87 74 $80- 61 S60- $40 $20- 0- 2007 2009 2011 2013 The amount of money college students spent in 2007 according to the formula to the left is $ billion. (Type an integer or a decimal.) Does the model underestimate or overestimate the amount of discretionary spending displayed by the bar graph? Select the correct choice below and, if necessary, fill in the answer box to complete your choice. (Type an integer or a decimal) O A. Overestimates…arrow_forward
- Drag the three points so they simultaneously follow both a LINEAR pattern and an EXPONENTIAL patternarrow_forwardThanks. How do you calculate this answer using the graphing calculator instead of Excel?arrow_forwardUse these model equations: the linear equation y=0.225x+12.45, the quadratic equation y=0.0032(x-30)*2+19.2, and the exponential equation y=1.90(1,08)*x a) Graph each equation on the same grid. Please complete thetable of values. Graph each equation on the same grid. b) Which model is most reasonable? Explain your answerarrow_forward
- College students are graduating with the highest debt burden in history. The bar graph shows the mean, or average, student-loan debt in the United States for five selected graduating years from 2001 through 2013. Here are two mathematical models for the data shown by the graph. In each formula, D represents mean student-loan debt, in dollars, x years after 2000. The Model 1 is, D = 1188x + 16,218 and the Model 2 is D = 46x2 + 541x + 17,650. Solve, a. Which model better describes the data for 2001?b. Does the polynomial model of degree 2 underestimate or overestimate the mean student-loan debt for 2013? By how much?arrow_forwardPediatric growth charts suggest a linear relationship between age (in years) and median height (in inches) for children between 2 and 12 years of age. Two year olds have a median height of 35 inches and 12 year olds have a median height of 60inches. Generate an equation to describe height as a of age. A) H(a)= -2.5a + 30 B) H(a)= 2.5a + 35 C) H(a)= 2.5a - 30 D) H(a)= .4a - 12 E) H(a)= 2.5a + 30arrow_forwardKathy puts $3000 into an account that pays 5% simple interest annually.a) Create a linear model to relate the amount of the investment, A, to time, t, in years.b) Graph the amount of the investment versus time.c) How long will it take for Kathy’s investment to double in value?d) What interest rate is required for the investment to double in value in 10 years?arrow_forward
- only do part barrow_forwardThe graph shows the weight of recyclable waste collected in a city from 2011 to 2014. Weight (Tons) 100 80 40 20 10 2011 2012 2013 2014 © 2020 StrongMind. Created using GeoGebra. Why is the graph misleading? The weights on the vertical axis are not evenly spaced. The years on the horizontal axis are not evenly spaced. The bars are too tall. The years are in the wrong order.arrow_forwardE sa Module 1: Journal O GRAPHS AND FUNCTIONS Writing an equation and drawing its graph to model a real-world... Equation: Greg is driving on the highway. He begins the trip with 18 gallons of gas in his car. The car uses up one gallon of gas every 25 miles. Let G represent the number of gallons of gas he has left in his tank, and let D represent the total distance (in miles) he has traveled. Write an equation relating G to D, and then graph your equation using the axes below. Explanation esc tab caps lock shift fn Check 1 F1 Q 2 0=0 control 12 A X W alt = # 3 N S option 3 888 E $ 4 D X FP 20- command R 18+ G 16+ 14+ 124 10- 8- % 5 6+ 2- 0 FS F C 15 30 45 60 M A T 6 + 16 G V 25 ++ ++ 90 105 130 135 150 145 & 7 Y H B D11 8 D © 2023 McGraw Hill LLC. All Rights Reserved Terms of Use | Privacy Center U 14 N 1 9 H 19 X 1 O K M F 0 5 0/3 ivacy Center Accessibilty + 38 P L : Savannah V > ? 90 command ? D Españo I 9/1 ? delete optionarrow_forward
 Glencoe Algebra 1, Student Edition, 9780079039897...AlgebraISBN:9780079039897Author:CarterPublisher:McGraw Hill
 Trigonometry (MindTap Course List)TrigonometryISBN:9781337278461Author:Ron LarsonPublisher:Cengage Learning
 Algebra and Trigonometry (MindTap Course List)AlgebraISBN:9781305071742Author:James Stewart, Lothar Redlin, Saleem WatsonPublisher:Cengage Learning
 Big Ideas Math A Bridge To Success Algebra 1: Stu...AlgebraISBN:9781680331141Author:HOUGHTON MIFFLIN HARCOURTPublisher:Houghton Mifflin Harcourt
 Linear Algebra: A Modern IntroductionAlgebraISBN:9781285463247Author:David PoolePublisher:Cengage Learning