
Concept explainers
Videos
Continuous Uniform Distribution. In Exercises 5–8, refer to the continuous uniform distribution depicted in Figure 6-2 and described in Example 1. Assume that a passenger is randomly selected, and find the probability that the waiting time is within the given
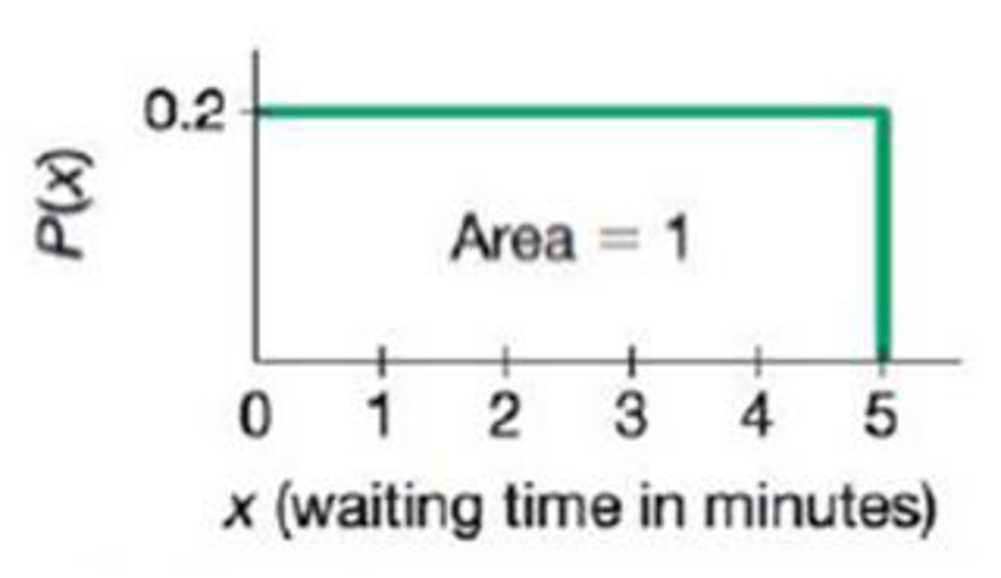
FIGURE 6-2
8. Between 2.5 minutes and 4.5 minutes

Learn your wayIncludes step-by-step video

Chapter 6 Solutions
Essentials of Statistics Plus MyLab Statistics with Pearson eText -- Access Card Package (6th Edition) (What's New in Statistics)
Additional Math Textbook Solutions
Statistical Reasoning for Everyday Life (5th Edition)
Statistics for Business and Economics (13th Edition)
Elementary Statistics: Picturing the World (6th Edition)
Introductory Statistics (10th Edition)
Introductory Statistics
Elementary Statistics Using Excel (6th Edition)


- Using the data in Table 6–11, calculate a 3-month moving average forecastfor month 12.arrow_forwardRegression and Predictions. Exercises 13–28 use the same data sets as Exercises 13–28 in Section 10-1. In each case, find the regression equation, letting the first variable be the predictor (x) variable. Find the indicated predicted value by following the prediction procedure summarized in Figure 10-5 on page 493. Old Faithful Using the listed duration and interval after times, find the best predicted “interval after” time for an eruption with a duration of 253 seconds. How does it compare to an actual eruption with a duration of 253 seconds and an interval after time of 83 minutes?arrow_forwardExhibit 6-2 The time it takes for a college student to travel between her home and her college is uniformly distributed between 40 and 90 minutes. 3. Refer to Exhibit 6-2. The probability that she will finish her trip in 80 minutes or less is .2 .02 1 .8arrow_forward
- Calculate the relative frequency P(E). You roll two dice 10 times. Both dice show the same number 2 times, and on 3 rolls, exactly one number is odd. E is the event that the sum of the numbers is even. P(E) =arrow_forwardExhibit 5-1The following represents the probability distribution for the daily demand of microcomputers at a local store. Demand Probability 0 .1 1 .2 2 .3 3 .2 4 .2 Refer to Exhibit 5-1. The probability of having a demand for at least two microcomputers is _____.arrow_forwardAssume that the amount of time until a kid gets bored and wants to leave a playground can be modeled using exponential distribution. Given that 5 kids leave a particular playground on average per hour, if a kid has already played 10 minutes there what is the probability he will have spent at least a total of 25 minutes before he leaves? OA. 0.1245 OB. 0.7135 OC. 0.8755 OD. 0.2865arrow_forward
- Calls arrive at a switchboard with a mean of one every 11 seconds. What is the exponential probability that it will take more than 21 seconds for the next call to arrive?arrow_forwardProbability Lecture.arrow_forwardAssume that the amount of time until a kid gets bored and wants to leave a playground can be modeled using exponential distribution. Given that 5 kids leave a particular playground on average per hour, if a kid has already played 10 minutes there what is the probability he will have spent at least a total of 25 minutes before he leaves? OA. 0.2865 OB. 0,7135 OC 0.8755 OD.0.1245arrow_forward
- please solve the following The manager of the emergency room (ER) at a large hospital is to count the number of patients arriving at the ER to receive medical attention, per hour. He randomly picks 11 one-hour time intervals, and counts the number of people arriving to receive medical attention in each of these 11 one-hour time intervals.He notices that this count fluctuates from one-hour to the next.Identify the probability model that best models such fluctuations.A. Uniform distributionB. Hypergeometric distributionC. Binomial distributionD. Random distributionE. Poisson distributionF. Bernoulli distributionG. none of the above A lottery consists of picking 5 numbers from 1 to 50, the winner of this lottery has to match all numbers chosen. That is, his/her 5 numbers have to match the 5 numbers taken from 1 to 50.A player of this lottery is to count how many of his/her numbers match the winning 5-number combination.Identify the probability model that best models this count.A.…arrow_forwardnt: Chapter 5 Assignment Exercise 05.08 Algo (Developing Discrete Probability Distributions) x 1 2 The following data were collected by counting the number of operating rooms in use at Tampa General Hospital over a 20-day period: On three of the days only one operating room was used, on five of the days two were used, on eight of the days three were used, and on four days all four of the hospital's operating rooms were used. Round your answers to two decimal places. a. Use the relative frequency approach to construct an empirical discrete probability distribution for the number of operating rooms in use on any given day. 3 4 f(x) ***** Total b. Select a graph of the probability distribution. 3111 Save hp Assignment Score: 90.35% Submit Assignment for Grading Question 8 of 10 ► Hint(s) Check My Work Sep 17 11:3arrow_forwardPart A of this Question, In general what are the steps to finding the distribution of the Xbar?arrow_forward
 MATLAB: An Introduction with ApplicationsStatisticsISBN:9781119256830Author:Amos GilatPublisher:John Wiley & Sons Inc
 Probability and Statistics for Engineering and th...StatisticsISBN:9781305251809Author:Jay L. DevorePublisher:Cengage Learning
 Statistics for The Behavioral Sciences (MindTap C...StatisticsISBN:9781305504912Author:Frederick J Gravetter, Larry B. WallnauPublisher:Cengage Learning
 Elementary Statistics: Picturing the World (7th E...StatisticsISBN:9780134683416Author:Ron Larson, Betsy FarberPublisher:PEARSON
 The Basic Practice of StatisticsStatisticsISBN:9781319042578Author:David S. Moore, William I. Notz, Michael A. FlignerPublisher:W. H. Freeman
 Introduction to the Practice of StatisticsStatisticsISBN:9781319013387Author:David S. Moore, George P. McCabe, Bruce A. CraigPublisher:W. H. Freeman