
Concept explainers
Videos
Seat Designs. In Exercises 13–20, use the data in the table below for sitting adult males and females (based on anthropometric survey data from Gordon, Churchill, et al.). These data are used often in the design of different seats, including aircraft seats, train seats, theater seats, and classroom seats. (Hint: Draw a graph in each case.)
Sitting Back-to-Knee Length (inches)
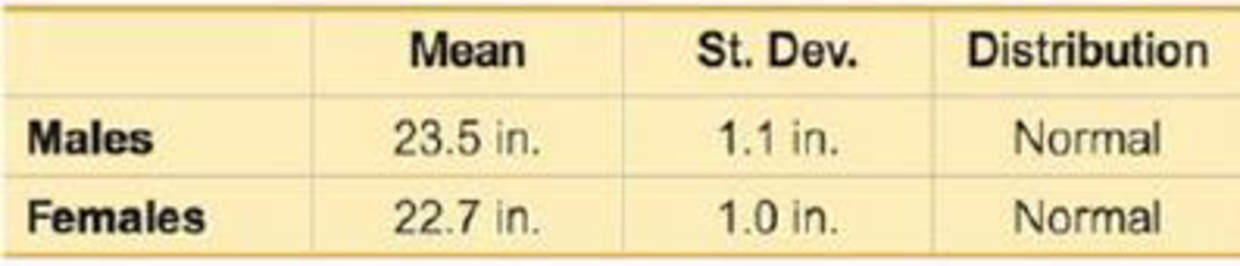
18. For females, find the first

Learn your wayIncludes step-by-step video

Chapter 6 Solutions
MYSTATLAB W/IR WORKSHEETS
Additional Math Textbook Solutions
Introductory Statistics (2nd Edition)
Introductory Statistics (10th Edition)
Intro Stats, Books a la Carte Edition (5th Edition)
Elementary Statistics: Picturing the World (6th Edition)
Elementary Statistics: Picturing the World (7th Edition)


- Height Data: GENDER (1 equals M) HEIGHT 0 171.6 1 184.4 0 153.2 1 161.8 1 179.6 1 165.9 1 178.5 1 157.2 0 156.1 1 181.4 1 166.2 0 167.7 1 179.9 1 171.1 0 163.1 0 158.2 1 180.8 0 155.1 0 179.9 1 173.4 1 172.1 1 176.1 1 155.6 1 181.4 0 150.4 1 183.8 1 170.5 0 155.9 0 157.2 1 161.8 0 155.8 0 156.9 0 155.8 0 154.9 0 162.8 1 165.9 0 159.8 0 163.5 0 165.7 0 169.2 1 154.6 1 179.7 1 175.2 0 154.3 0 160.3 0 167.9 1 175.1 0 157.1 0 170.3 1 179.4 1 183.2 0 170.6 0 152.2 0 160.5 0 157.2 1 171.3 1 174.1 0 172.4 0 161.5 0 164.5 0 171.2 0 153.9 1 183.2 1 180.5 0 135.7 1 187.7 1 175.5 1 167.8 0 167.7 1 178.8 1 173.6 0 160.1 0 156.4 0 167.9 1 188.2 0 157.1 0 176.8 1 179.1 1 178.7 1 180.7 1 176.3 0 153.1 1 180.1 0 163.3 0 160.5 1 171.1 0 167.5 1 171.3 0 159.9 0 155.6 0 158.2 1 166.6 1 167.6 1 174.5 0 168.9 0…arrow_forwardpart e asks to choose one of the box plotsarrow_forwardA. Directions: Analyze, interpret and make conclusion out of the given data.arrow_forward
- Which of the following is NOT one of the main sections of most research papers in the behavioral and social sciences? a) Case Report b) Introduction c) Methods d) Discussionarrow_forwardUsing the displays in part ‘a’ sheet 2, compare and contrast the two data sets.arrow_forwardThe maximum discount value of the Entertainment® card for the “Fine Dining” section, Edition 10, for various pages is given below. Page number Maximum value ($)4 1614 1925 1532 1743 1957 1572 1685 1590 17a) Decide which variable should be the independent variable and which should be the dependent variable. Justify your choice. b) Draw a scatter plot of the ordered pairs. c) Does it appear that the restaurants giving the maximum value are placed in the beginning of the “Fine Dining” section? How did you arrive at your answer? d) What is the slope of the least squares (best-fit) line? Interpret the slope. e) What is the intercept of the least squares (best-fit) line? Interpret the intercept. f) Write down the equation for the least squares line. Interpret your equation. g) Find the estimated maximum…arrow_forward
- QUESTION (3C.PNG) BASIS OF THE DATA (DATA.PNG)arrow_forward5) Which type of data is provided in the scenario given below? a.) neither accurate nor precise b.) accurate, but not precise c.) precise, but not accurate d.) precise and accuratearrow_forwardThe Conch Café, located in Gulf Shores, Alabama, features casual lunches with a great view of the Gulf of Mexico. To accommodate the increase in business during the summer vacation season, Fuzzy Conch, the owner, hires a large number of servers as seasonal help. When he interviews a prospective server, he would like to provide data on the amount a server can earn in tips. He believes that the amount of the bill and the number of diners are both related to the amount of the tip. He gathered the following sample information. Customer Amount of Tip Amount of Bill Number of Diners Customer Amount of Tip Amount of Bill Number of Diners 1 $ 6.05 $ 73.22 1 16 $ 3.30 $ 23.59 2 2 4.50 28.23 4 17 3.50 22.30 2 3 1.00 10.65 1 18 3.25 32.00 2 4 2.40 19.82 3 19 5.40 50.02 4 5 5.00 28.62 3 20 2.25 17.60 3 6 4.25 24.83 2 21 1.40 41.80 5 7 .50 6.25 1 22 3.00 20.27 2…arrow_forward
- The Conch Café, located in Gulf Shores, Alabama, features casual lunches with a great view of the Gulf of Mexico. To accommodate the increase in business during the summer vacation season, Fuzzy Conch, the owner, hires a large number of servers as seasonal help. When he interviews a prospective server, he would like to provide data on the amount a server can earn in tips. He believes that the amount of the bill and the number of diners are both related to the amount of the tip. He gathered the following sample information. Customer Amount of Tip Amount of Bill Number of Diners Customer Amount of Tip Amount of Bill Number of Diners 1 $ 7.00 $ 48.97 5 16 $ 3.30 $ 23.59 2 2 4.50 28.23 4 17 3.50 22.30 2 3 1.00 10.65 1 18 3.25 32.00 2 4 2.40 19.82 3 19 5.40 50.02 4 5 5.00 28.62 3 20 2.25 17.60 3 6 4.25 24.83 2 21 5.50 44.47 4 7 0.50 6.24 1 22 3.00 20.27 2…arrow_forwardcontruct a chi sqaured analysis from the data below 2010 2011 2012 2013 2014 2015 2016 2017 2018 2019 2020 2021 2022 2,213,138 2,455,937 2,987,097 3,234,543 3,329,323 3,545,944 3,033,529 3,116,399 3,222,559 3,919,505 4,123,987 4,398,345 4,564,567arrow_forwardA. Clearly state an appropriate null hypothesis and an alternative hypothesis. B. What proportion of deaths occurred while the windows were set at a vertical orientation? C. What statistical test would you use to test the null hypothesis? D. Carry out the statistical test from part (c). Is there evidence that window angle affects the mortality rates of birds?arrow_forward
 Big Ideas Math A Bridge To Success Algebra 1: Stu...AlgebraISBN:9781680331141Author:HOUGHTON MIFFLIN HARCOURTPublisher:Houghton Mifflin Harcourt