
Concept explainers
Videos
40. California Lottery Mega Numbers. The histogram in Figure 6.9 shows the distribution of “Mega” numbers (possible values
a. Assuming the lottery drawings are random, what would you expect the probability of any Mega number to be?
b. Based on the histogram, what Mega number occurred most often and what was its relative frequency?
c. What would the histogram in Figure 6.9 look like if it represented billions of Mega numbers instead of 1639?
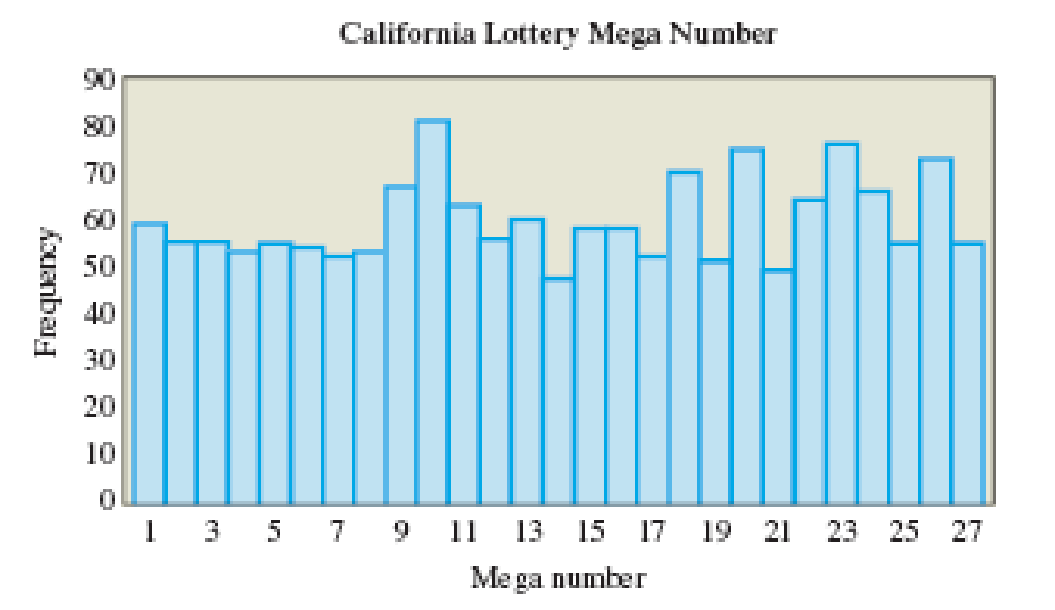
Figure 6.9
Want to see the full answer?
Check out a sample textbook solution
Chapter 6 Solutions
Statistical Reasoning for Everyday Life Plus MyLab Statistics with Pearson eText -- 18 Week Access Card Package (5th Edition)


 Glencoe Algebra 1, Student Edition, 9780079039897...AlgebraISBN:9780079039897Author:CarterPublisher:McGraw Hill
 Holt Mcdougal Larson Pre-algebra: Student Edition...AlgebraISBN:9780547587776Author:HOLT MCDOUGALPublisher:HOLT MCDOUGAL
 Calculus For The Life SciencesCalculusISBN:9780321964038Author:GREENWELL, Raymond N., RITCHEY, Nathan P., Lial, Margaret L.Publisher:Pearson Addison Wesley,