
Statistical Reasoning for Everyday Life Plus MyLab Statistics with Pearson eText -- 18 Week Access Card Package (5th Edition)
5th Edition
ISBN: 9780135990278
Author: Bennett, Jeffrey O., Briggs, William L., Triola, Mario F.
Publisher: PEARSON
expand_more
expand_more
format_list_bulleted
Concept explainers
Videos
Textbook Question
Chapter 6.4, Problem 10E
Commercial Aviation. For Exercises 9–12, use the following table, which summarizes some data on commercial aviation flights in the United States for three separate years.
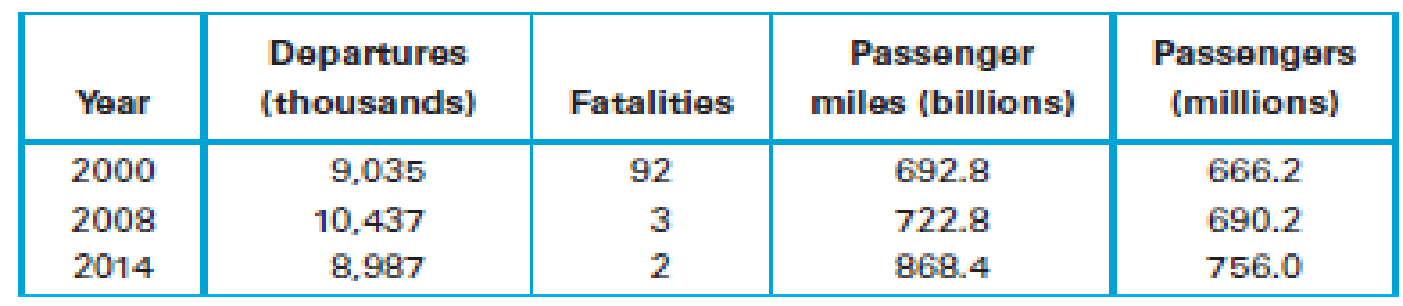
- 10. For each of the three years, find the fatality rate in deaths per billion passenger miles. On the basis of those rates, which year was the safest? Why?
Expert Solution & Answer
Want to see the full answer?
Check out a sample textbook solution
Students have asked these similar questions
Using the data in Table 6–11, calculate a 3-month moving average forecast for month 12.
Table 3.5 provides the number of deaths from all causes and from accidents (unintentional injuries) by age group in the United States in 2002. Review the following rates. Determine what to call each one, then calculate it using the data provided in Table.
1. Unintentional-injury-specific mortality rate for the entire population. Calculate cause-specific mortality rate.
2. All-cause mortality rate for 25–34 years old. Calculate the age-specific mortality rate.
3. All-cause mortality among males. Calculate the sex-specific mortality rate.
4.Unintentional-injury specific mortality among 25 to 34 years old males. Calculate the is a cause-specific, age-specific, and sex-specific mortality rate
The table shows the historical in-state tuition rates for the University of Kalamazoo. Use the data to answer the questions and round your answers to two decimal places.
Academic year
Rate of tuition for one semester
2008–2009
$3,812
2009–2010
$4,002
2010–2011
$4,441
2011–2012
$4,905
2012–2013
$5,181
What is the percentage increase in tuition from the 2008–2009 school year to the 2012–2013 school year?
Chapter 6 Solutions
Statistical Reasoning for Everyday Life Plus MyLab Statistics with Pearson eText -- 18 Week Access Card Package (5th Edition)
Ch. 6.1 - Coin Tossing. Suppose you toss a coin 100 times....Ch. 6.1 - Statistical Significance. What do we mean when we...Ch. 6.1 - Prob. 3ECh. 6.1 - Quantifying Significance. What does it mean to say...Ch. 6.1 - Does It Make Sense? For Exercises 58, determine...Ch. 6.1 - Does It Make Sense? For Exercises 58, determine...Ch. 6.1 - Does It Make Sense? For Exercises 58, determine...Ch. 6.1 - Does It Make Sense? For Exercises 58, determine...Ch. 6.1 - Subjective Significance. For each event in...Ch. 6.1 - Subjective Significance. For each event in...
Ch. 6.1 - Subjective Significance. For each event in...Ch. 6.1 - Subjective Significance. For each event in...Ch. 6.1 - Subjective Significance. For each event in...Ch. 6.1 - Subjective Significance. For each event in...Ch. 6.1 - Subjective Significance. For each event in...Ch. 6.1 - Subjective Significance. For each event in...Ch. 6.1 - Prob. 17ECh. 6.1 - Carpal Tunnel Syndrome Treatments. An experiment...Ch. 6.1 - Prob. 19ECh. 6.1 - Prob. 20ECh. 6.1 - Human Body Temperature. In a study by researchers...Ch. 6.1 - Seat Belts and Children. In a study of children...Ch. 6.1 - Prob. 23ECh. 6.1 - Subjective Significance. For each event in...Ch. 6.2 - Outcomes and Events. Distinguish between an...Ch. 6.2 - Notation. What does it mean when we write P(A)?...Ch. 6.2 - Probability Types. Briefly describe the...Ch. 6.2 - Prob. 4ECh. 6.2 - Prob. 5ECh. 6.2 - Does It Make Sense? For Exercises 58, determine...Ch. 6.2 - Prob. 7ECh. 6.2 - Does It Make Sense? For Exercises 58, determine...Ch. 6.2 - Counting Outcomes. How many different three-child...Ch. 6.2 - Prob. 10ECh. 6.2 - Theoretical Probabilities. For Exercises 1120, use...Ch. 6.2 - Theoretical Probabilities. For Exercises 1120, use...Ch. 6.2 - Theoretical Probabilities. For Exercises 1120, use...Ch. 6.2 - Theoretical Probabilities. For Exercises 1120, use...Ch. 6.2 - Theoretical Probabilities. For Exercises 1120, use...Ch. 6.2 - Theoretical Probabilities. For Exercises 1120, use...Ch. 6.2 - Theoretical Probabilities. For Exercises 1120, use...Ch. 6.2 - Theoretical Probabilities. For Exercises 1120, use...Ch. 6.2 - Theoretical Probabilities. For Exercises 1120, use...Ch. 6.2 - Theoretical Probabilities. For Exercises 1120, use...Ch. 6.2 - Days of the Week. What is the probability of...Ch. 6.2 - Days of the Week. What is the probability of...Ch. 6.2 - Complementary Events. Exercises 2330 involve...Ch. 6.2 - Complementary Events. Exercises 2330 involve...Ch. 6.2 - Complementary Events. Exercises 2330 involve...Ch. 6.2 - Complementary Events. Exercises 2330 involve...Ch. 6.2 - Complementary Events. Exercises 2330 involve...Ch. 6.2 - Complementary Events. Exercises 2330 involve...Ch. 6.2 - Prob. 29ECh. 6.2 - Prob. 30ECh. 6.2 - Theoretical Probabilities. For Exercises 3134, use...Ch. 6.2 - Theoretical Probabilities. For Exercises 3134, use...Ch. 6.2 - Theoretical Probabilities. For Exercises 3134, use...Ch. 6.2 - Theoretical Probabilities. For Exercises 3134, use...Ch. 6.2 - Relative Frequency Probabilities. Use the relative...Ch. 6.2 - Relative Frequency Probabilities. Use the relative...Ch. 6.2 - Relative Frequency Probabilities. Use the relative...Ch. 6.2 - Prob. 38ECh. 6.2 - Probability Distributions. In Exercises 39 and 40,...Ch. 6.2 - Probability Distributions. In Exercises 39 and 40,...Ch. 6.3 - Law of Large Numbers. What is the law of large...Ch. 6.3 - Understanding the Law of Large Numbers. In terms...Ch. 6.3 - Expected Value. What is an expected value, and how...Ch. 6.3 - Gamblers Fallacy. What is the gamblers fallacy?...Ch. 6.3 - Prob. 5ECh. 6.3 - Does It Make Sense? For Exercises 58, determine...Ch. 6.3 - Prob. 7ECh. 6.3 - Does It Make Sense? For Exercises 58, determine...Ch. 6.3 - Gender Selection. In analyzing genders of...Ch. 6.3 - Speedy Driver. A person who has a habit of driving...Ch. 6.3 - Should You Play? Suppose you are offered this...Ch. 6.3 - Kentuckys Pick 4 Lottery. If you bet 1 in...Ch. 6.3 - Expected Value for Life Insurance. There is a...Ch. 6.3 - Expected Value for Life Insurance There is a...Ch. 6.3 - Expected Waiting Time. You arrive at a bus stop...Ch. 6.3 - Expected Value in Roulette. As shown in Figure...Ch. 6.3 - Expected Value in Casino Dice. When you give a...Ch. 6.3 - New Jersey Pick 4. In New Jerseys Pick 4 lottery,...Ch. 6.3 - Extra Points in Football. Football teams have the...Ch. 6.3 - Prob. 20ECh. 6.3 - Psychology of Expected Values. In 1953, a French...Ch. 6.3 - Behind in Coin Tossing: Can You Catch Up? Suppose...Ch. 6.4 - Risk and Travel. What is travel risk? Give an...Ch. 6.4 - Prob. 2ECh. 6.4 - Prob. 3ECh. 6.4 - Prob. 4ECh. 6.4 - Prob. 5ECh. 6.4 - Does It Make Sense? For Exercises 58, determine...Ch. 6.4 - Prob. 7ECh. 6.4 - Prob. 8ECh. 6.4 - Prob. 9ECh. 6.4 - Commercial Aviation. For Exercises 912, use the...Ch. 6.4 - Commercial Aviation. For Exercises 912, use the...Ch. 6.4 - Prob. 12ECh. 6.4 - Births/Deaths. For Exercises 1316, use the data in...Ch. 6.4 - Births/Deaths. For Exercises 1316, use the data in...Ch. 6.4 - Births/Deaths. For Exercises 1316, use the data in...Ch. 6.4 - Births/Deaths. For Exercises 1316, use the data in...Ch. 6.4 - Vital Statistics. For Exercises 1720, use the data...Ch. 6.4 - Vital Statistics. For Exercises 1720, use the data...Ch. 6.4 - Prob. 19ECh. 6.4 - Prob. 20ECh. 6.4 - Prob. 21ECh. 6.4 - Prob. 22ECh. 6.4 - Prob. 23ECh. 6.4 - Prob. 24ECh. 6.4 - Prob. 25ECh. 6.4 - Prob. 26ECh. 6.4 - Prob. 27ECh. 6.4 - Prob. 28ECh. 6.4 - Life in This Century. Example 5 assumed that the...Ch. 6.4 - Prob. 30ECh. 6.5 - Independence. Let A denote the event of getting a...Ch. 6.5 - Independence. A geneticist is working with 3 green...Ch. 6.5 - Prob. 3ECh. 6.5 - Complementary Events. Let A be the event of...Ch. 6.5 - Prob. 5ECh. 6.5 - Does It Make Sense? For Exercises 58, determine...Ch. 6.5 - Does It Make Sense? For Exercises 58, determine...Ch. 6.5 - Does It Make Sense? For Exercises 58, determine...Ch. 6.5 - Births. Assume that boys and girls are equally...Ch. 6.5 - Births. A couple plans to have four children. Find...Ch. 6.5 - Password. A programmer is instructed to create a...Ch. 6.5 - Wearing Hunter Orange. A study of hunting injuries...Ch. 6.5 - Songs. The 50 songs on a smartphone consist of 15...Ch. 6.5 - Polls. A pollster plans to call adults. She has a...Ch. 6.5 - Probability and Court Decisions. In Exercises...Ch. 6.5 - Probability and Court Decisions. In Exercises...Ch. 6.5 - Probability and Court Decisions. In Exercises...Ch. 6.5 - Probability and Court Decisions. In Exercises...Ch. 6.5 - Probability and Court Decisions. In Exercises...Ch. 6.5 - Probability and Court Decisions. In Exercises...Ch. 6.5 - Prob. 21ECh. 6.5 - Pedestrian Deaths. For Exercises 2126, use the...Ch. 6.5 - Prob. 23ECh. 6.5 - Pedestrian Deaths. For Exercises 2126, use the...Ch. 6.5 - Prob. 25ECh. 6.5 - Pedestrian Deaths. For Exercises 2126, use the...Ch. 6.5 - Clinical Trial. In a clinical trial of an allergy...Ch. 6.5 - Prob. 28ECh. 6.5 - Prob. 29ECh. 6.5 - Survey Refusals. Refer to the data in Exercise 29....Ch. 6.5 - Drug Testing. A 1-Panel-THC test for marijuana use...Ch. 6.5 - BINGO. The game of BINGO involves drawing numbered...Ch. 6 - For Exercises 17, use the data in the following...Ch. 6 - For Exercises 17, use the data in the following...Ch. 6 - For Exercises 17, use the data in the following...Ch. 6 - For Exercises 17, use the data in the following...Ch. 6 - For Exercises 17, use the data in the following...Ch. 6 - For Exercises 17, use the data in the following...Ch. 6 - For Exercises 17, use the data in the following...Ch. 6 - The Binary Computer Company manufactures computer...Ch. 6 - For a recent year, the fatality rate from motor...Ch. 6 - A Las Vegas handicapper can correctly predict the...Ch. 6 - For the handicapper in Exercise 1, find the...Ch. 6 - In a clinical trial of the effectiveness of a...Ch. 6 - If P(A) = 0.65, what is the value of P(not A)?Ch. 6 - In Exercises 610, use the following results. The...Ch. 6 - In Exercises 610, use the following results. The...Ch. 6 - Prob. 8CQCh. 6 - In Exercises 610, use the following results. The...Ch. 6 - In Exercises 610, use the following results. The...
Knowledge Booster


Learn more about
Need a deep-dive on the concept behind this application? Look no further. Learn more about this topic, statistics and related others by exploring similar questions and additional content below.Similar questions
- Because of high tuition costs at state and private universities, enrollments atcommunity colleges have increased dramatically in recent years. The following data show theenrollment (in thousands) for Jefferson Community College from 2001–2009:Year Period (t) Enrollment (1000s)2001 1 6.52002 2 8.12003 3 8.42004 4 10.22005 5 12.52006 6 13.32007 7 13.72008 8 17.22009 9 18.1Compute F10: the Forecast for 2010. Compute Pearson’s Correlation Coefficient Use the Method of Least Squares to obtain the Best-Fit-Line for this data. Use the line to compute the forecast.arrow_forwardUse the table to answer the following questions. Year U.S population (millions) Traffic fatalities Licensed drivers(millions) Vehicle-miles (trillions) 1995 263 41,817 177 2.4 2015 321 35,092 218 3.1 Find and compare death rates per person and per 100,000 people for traffic fatalities per two years. Express the 1995 and 2015 fatality rates in deaths per100 million vehicle-miles traveled. Express the 1995 and 2015 fatality rates in deaths per 100,000 population. Express the 1995 and 2015 fatality rates in deaths per 100,000 licensed driversarrow_forwardThe table below shows the share of income going to each quintile of the income distribution for Neverland in 1980 and 1990. Complete the table below finding the the cumulative share of income for 1980 and 1990 and answer the following: Share of income in Cumulative share of Share of income in Cumulative share of Quintiles 1980 income in 1980 1990 income in 1990 1st 7% 6.6.% 2nd 11.5% 11.5% 3rd 17% 16.3% 4th 24.8% 22.7% 5th 39.7% 42.9% a) Sketch the Perfect Equality line and the Lorenz curve for 1980 and for 1990. Don't forget to label your graph and your curves! b) According to the Lorenz curves that you draw in (a), which year had worse income inequality, 1980 or 1990? JUSTIFY your answer! NOTE: This is a file upload question. Work your answer in a piece of paper, take a picture and upload your file.arrow_forward
- show solutionarrow_forwardTrying to determine the number of students to accept is a tricky task for universities. The Admissions staff at a small private college wants to use data from the past few years to predict the number of students enrolling in the university from those who are accepted by the university. The data are provided in the following table. R F eTextbook and Media Save for Late O % 5 T O >> G H (9) 2 Number Accepted Number Enrolled Find the correlation between the number of students accepted and enrolled. Use two decimal places in your answer. & 2,440 2,800 2,720 2,360 2,660 2,620 8 6 611 K 708 637 584 614 625 ( 9 L Attempts: 0 of 1 used ) 0 P Submit Answer 56°F Cl Backspaarrow_forwardThe table below shows the number of state-registered automatic weapons and the murder rate for several Northwestern states. 11.5 8.6 6.9 3.4 2.3 2.7 2.4 0.5 14 11.3 9.7 6.9 6.1 6.5 5.9 4.8 thousands of automatic weapons = murders per 100,000 residents 0.84x + 4.13. Use this equation to answer the following; This data can be modeled by the equation y Special Note: I suggest you verify this equation by performing linear regression on your calculator. A) How many murders per 100,000 residents can be expected in a state with 1.1 thousand automatic weapons? Answer = Round to 3 decimal places. B) How many murders per 100,000 residents can be expected in a state with 7.1 thousand automatic weapons? Answer Round to 3 decimal places. %3Darrow_forward
- The weather in Los Angeles is dry most of the time, but it can be quite rainy in the winter. The rainiest month of the year is February. The following table presents the annual rainfall in Los Angeles, in inches, for each February from 1965 to 2006. 0.2 3.7 1.2 13.7 1.5 0.2 1.7 0.6 0.1 8.9 1.9 5.5 0.5 3.1 3.1 8.9 8.0 12.7 4.1 0.3 2.6 1.5 8.0 4.6 0.7 0.7 6.6 4.9 0.1 4.4 3.2 11.0 7.9 0.0 1.3 2.4 0.1 2.8 4.9 3.5 6.1 0.1 a. Construct a stem-and-leaf plot for these data. b. Construct a histogram for these data. C. Construct a dotplot for these data. d. Construct a boxplot for these data. Does the box-plot show any outliers?arrow_forwardThe table to the right represents the annual percentage of smartphones sold in a certain region in 2011, 2012, and 2013 (projected). a. What conclusions can you reach about the market for smartphones in 2011, 2012, and 2013? b. What differences are there in the market for smartphones in 2011, 2012, and 2013? Type Type 1 Type 2 Type 3 Type 4 Type 5 Type 6 2011 2012 52% 65% 18% 16% 1% 6% 13% 7% 13% 3% 4% 2% a. Select all that apply. A. Type 3 had the second largest percentage of smartphones sold in all three years. B. Type 2 had the second largest percentage of smartphones sold in all three years. C. Type 6 had the smallest or close to the smallest percentage of smartphones sold in all three years. D. Type 1 had the largest percentage of smartphones sold in all three years. E. Type 5 had the smallest or close to the smallest percentage of smartphones sold in all three years. 2013 54% 20% 18% 4% 2% 2%arrow_forwardAnswer 4 5 6 7arrow_forward
- The revenue for Google for the years 2010–2014 is shown in the following table (Wallstreet Journal, August 2014). Deflate the revenue in dollars based on the CPI (1982–1984base period). Comment on the company’s revenue in deflated dollars. Year Revenue ($ billions) CPI2010 29.3 218.12011 37.9 224.92012 50.2 229.62013 59.8 233.02014 66.7 236.7arrow_forwardA researcher wants to know how long it takes, on average, for a certain species of bacteria to divide. She watches 17 cells through a microscope and times how long it takes them to divide. She obtains the following data, in hours:8.1, 7, 7.4, 7.4, 6.6, 7.3, 7.5, 7, 7.7, 6.9, 7.9, 6.7, 6.7, 6.9, 7.5, 7.1, 7.3Assuming the population standard deviation is σ=0.4, construct a 89% confidence interval for the average time it takes this species of bacteria to divide.xˉ=α2=zα2=Margin of Error: E=We are 89% confident that this species of bacteria takes, on average, between ___hours and ___hours to divide.arrow_forwardYou have the following data: Gasoline Sales during 2017.1 to 2020.4 (in 000 of barrels) Year and quarter Gasoline Sales Year and quarter Gasoline sales 2017.1 22434 2019.1 22776 2017.2 23766 2019.2 24491 2017.3 23860 2019.3 24751 2017.4 23391 2019.4 24170 2018.1 22662 2020.1 23302 2018.2 24032 2020.2 24045 2018.3 24171 2020.3 25437 2018.4 23803 2020.4 25272 (A)Using data on gasoline sales (in thousands of barrels) from the first quarter of 2017 to the last quarter of 2020, estimate the secular linear trend equation. (B) Accordingly, forecast gasoline sales for the four quarters of 2021. (C)Use the dummy variables methods to adjust the trend forecasts for the four quarters of 2021 you made in (B) above to take the seasonal variations into account.arrow_forward
arrow_back_ios
SEE MORE QUESTIONS
arrow_forward_ios
Recommended textbooks for you
 MATLAB: An Introduction with ApplicationsStatisticsISBN:9781119256830Author:Amos GilatPublisher:John Wiley & Sons Inc
 Probability and Statistics for Engineering and th...StatisticsISBN:9781305251809Author:Jay L. DevorePublisher:Cengage Learning
 Statistics for The Behavioral Sciences (MindTap C...StatisticsISBN:9781305504912Author:Frederick J Gravetter, Larry B. WallnauPublisher:Cengage Learning
 Elementary Statistics: Picturing the World (7th E...StatisticsISBN:9780134683416Author:Ron Larson, Betsy FarberPublisher:PEARSON
 The Basic Practice of StatisticsStatisticsISBN:9781319042578Author:David S. Moore, William I. Notz, Michael A. FlignerPublisher:W. H. Freeman
 Introduction to the Practice of StatisticsStatisticsISBN:9781319013387Author:David S. Moore, George P. McCabe, Bruce A. CraigPublisher:W. H. Freeman
MATLAB: An Introduction with Applications
Statistics
ISBN:9781119256830
Author:Amos Gilat
Publisher:John Wiley & Sons Inc
Probability and Statistics for Engineering and th...
Statistics
ISBN:9781305251809
Author:Jay L. Devore
Publisher:Cengage Learning
Statistics for The Behavioral Sciences (MindTap C...
Statistics
ISBN:9781305504912
Author:Frederick J Gravetter, Larry B. Wallnau
Publisher:Cengage Learning
Elementary Statistics: Picturing the World (7th E...
Statistics
ISBN:9780134683416
Author:Ron Larson, Betsy Farber
Publisher:PEARSON
The Basic Practice of Statistics
Statistics
ISBN:9781319042578
Author:David S. Moore, William I. Notz, Michael A. Fligner
Publisher:W. H. Freeman
Introduction to the Practice of Statistics
Statistics
ISBN:9781319013387
Author:David S. Moore, George P. McCabe, Bruce A. Craig
Publisher:W. H. Freeman
Use of ALGEBRA in REAL LIFE; Author: Fast and Easy Maths !;https://www.youtube.com/watch?v=9_PbWFpvkDc;License: Standard YouTube License, CC-BY
Compound Interest Formula Explained, Investment, Monthly & Continuously, Word Problems, Algebra; Author: The Organic Chemistry Tutor;https://www.youtube.com/watch?v=P182Abv3fOk;License: Standard YouTube License, CC-BY
Applications of Algebra (Digit, Age, Work, Clock, Mixture and Rate Problems); Author: EngineerProf PH;https://www.youtube.com/watch?v=Y8aJ_wYCS2g;License: Standard YouTube License, CC-BY