
Essentials of Statistics (5th Edition)
5th Edition
ISBN: 9780321924599
Author: Mario F. Triola
Publisher: PEARSON
expand_more
expand_more
format_list_bulleted
Concept explainers
Videos
Textbook Question
Chapter 6.2, Problem 6BSC
Continuous Uniform Distribution. In Exercises 5–8, refer to the continuous uniform distribution depicted in Figure 6-2 and described in Example 1. Assume that a subway passenger is randomly selected, and find the
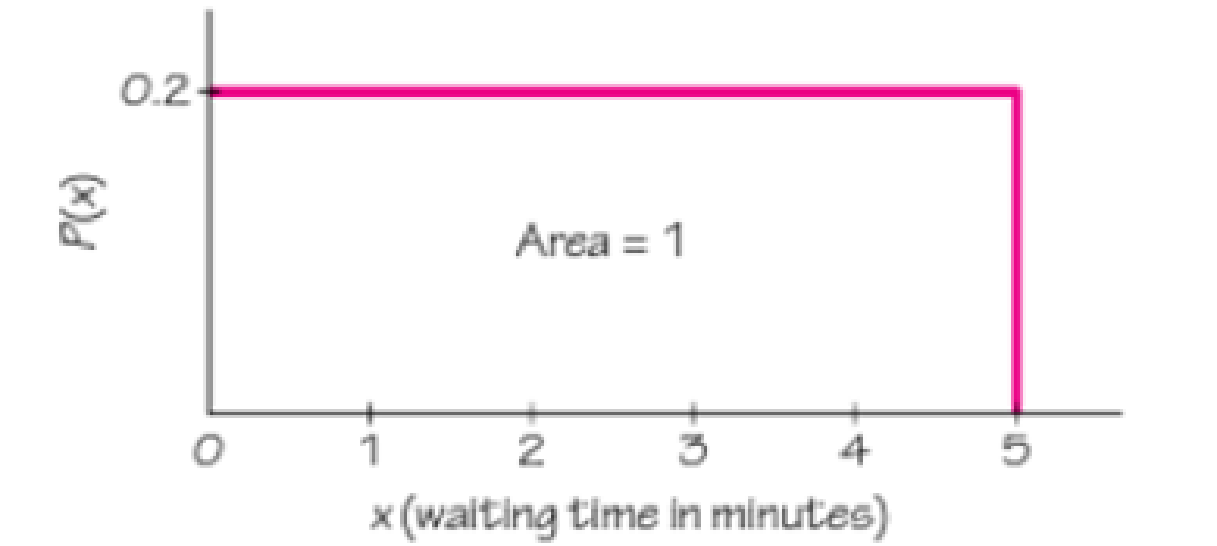
Figure 6-2 Uniform Distribution of Waiting Time
6. Less than 0.75 minutes
Expert Solution & Answer
Want to see the full answer?
Check out a sample textbook solution
Students have asked these similar questions
Using Normal Approximation. In Exercises 5–8, do the following: If the requirements of np ≥ 5 and nq are both satisfied, estimate the indicated probability by using the normal distribution as an approximation to the binomial distribution; if np ≤ 5 or nq < 5, then state that the normal approximation should not be used.
Births of Boys with n= = 8 births and p = 0.512 for a boy, find p (exactly 5 boys).
Using the Central Limit Theorem. In Exercises 5–8, assume that females have pulse rates that are normally distributed with a mean of 74.0 beats per minute and a standard deviation of 12.5 beats per minute (based on Data Set 1 “Body Data” in Appendix B).
a. If 1 adult female is randomly selected, find the probability that her pulse rate is greater than 70 beats per minute.
b. If 25 adult females are randomly selected, find the probability that they have pulse rates with a mean greater than 70 beats per minute.
c. Why can the normal distribution be used in part (b), even though the sample size does not exceed 30?
Probability Lecture.
Chapter 6 Solutions
Essentials of Statistics (5th Edition)
Ch. 6.2 - Normal Distribution When we refer to a normal...Ch. 6.2 - Normal Distribution A normal distribution is...Ch. 6.2 - Standard Normal Distribution Identify the...Ch. 6.2 - Notation What does the notation Z indicate?Ch. 6.2 - Continuous Uniform Distribution. In Exercises 58,...Ch. 6.2 - Continuous Uniform Distribution. In Exercises 58,...Ch. 6.2 - Continuous Uniform Distribution. In Exercises 58,...Ch. 6.2 - Continuous Uniform Distribution. In Exercises 58,...Ch. 6.2 - Prob. 9BSCCh. 6.2 - Standard Normal Distribution. In Exercises 912,...
Ch. 6.2 - Prob. 11BSCCh. 6.2 - Prob. 12BSCCh. 6.2 - Prob. 13BSCCh. 6.2 - Prob. 14BSCCh. 6.2 - Prob. 15BSCCh. 6.2 - Prob. 16BSCCh. 6.2 - Standard Normal Distribution. In Exercises 1736,...Ch. 6.2 - Standard Normal Distribution. In Exercises 1736,...Ch. 6.2 - Standard Normal Distribution. In Exercises 1736,...Ch. 6.2 - Standard Normal Distribution. In Exercises 1736,...Ch. 6.2 - Standard Normal Distribution. In Exercises 1736,...Ch. 6.2 - Standard Normal Distribution. In Exercises 1736,...Ch. 6.2 - Standard Normal Distribution. In Exercises 1736,...Ch. 6.2 - Standard Normal Distribution. In Exercises 1736,...Ch. 6.2 - Standard Normal Distribution. In Exercises 1736,...Ch. 6.2 - Prob. 26BSCCh. 6.2 - Standard Normal Distribution. In Exercises 1736,...Ch. 6.2 - Prob. 28BSCCh. 6.2 - Standard Normal Distribution. In Exercises 1736,...Ch. 6.2 - Standard Normal Distribution. In Exercises 1736,...Ch. 6.2 - Standard Normal Distribution. In Exercises 1736,...Ch. 6.2 - Standard Normal Distribution. In Exercises 1736,...Ch. 6.2 - Standard Normal Distribution. In Exercises 17-36,...Ch. 6.2 - Standard Normal Distribution. In Exercises 17-36,...Ch. 6.2 - Prob. 35BSCCh. 6.2 - Prob. 36BSCCh. 6.2 - Finding Bone Density Scores. In Exercises 37-40...Ch. 6.2 - Finding Bone Density Scores. In Exercises 37-40...Ch. 6.2 - Prob. 39BSCCh. 6.2 - Finding Bone Density Scores. In Exercises 37-40...Ch. 6.2 - Finding Critical Values. In Exercises 41-44, find...Ch. 6.2 - Prob. 42BSCCh. 6.2 - Prob. 43BSCCh. 6.2 - Prob. 44BSCCh. 6.2 - Prob. 45BSCCh. 6.2 - Prob. 46BSCCh. 6.2 - Prob. 47BSCCh. 6.2 - Prob. 48BSCCh. 6.2 - Prob. 49BBCh. 6.2 - Distributions In a continuous uniform...Ch. 6.3 - Pulse Rates Pulse rates of women are normally...Ch. 6.3 - IQ Scores The Wechsler Adult Intelligence Scale is...Ch. 6.3 - Prob. 3BSCCh. 6.3 - Random Digits Computers are commonly used to...Ch. 6.3 - IQ Scores. In Exercises 5-8, find the area of the...Ch. 6.3 - Prob. 6BSCCh. 6.3 - Prob. 7BSCCh. 6.3 - Prob. 8BSCCh. 6.3 - Prob. 9BSCCh. 6.3 - Prob. 10BSCCh. 6.3 - Prob. 11BSCCh. 6.3 - Prob. 12BSCCh. 6.3 - IQ Scores. In Exercises 13-20, assume that adults...Ch. 6.3 - IQ Scores. In Exercises 13-20, assume that adults...Ch. 6.3 - IQ Scores. In Exercises 13-20, assume that adults...Ch. 6.3 - IQ Scores. In Exercises 13-20, assume that adults...Ch. 6.3 - IQ Scores. In Exercises 13-20, assume that adults...Ch. 6.3 - IQ Scores. In Exercises 13-20, assume that adults...Ch. 6.3 - IQ Scores. In Exercises 13-20, assume that adults...Ch. 6.3 - IQ Scores. In Exercises 13-20, assume that adults...Ch. 6.3 - In Exercises 21-24, use these parameters (based on...Ch. 6.3 - In Exercises 21-24, use these parameters (based on...Ch. 6.3 - Prob. 23BSCCh. 6.3 - In Exercises 21-24, use these parameters (based on...Ch. 6.3 - Water Taxi Safety When a water taxi sank in...Ch. 6.3 - Prob. 26BSCCh. 6.3 - Prob. 27BSCCh. 6.3 - Prob. 28BSCCh. 6.3 - Prob. 29BSCCh. 6.3 - Aircraft Seat Width Engineers want to design seats...Ch. 6.3 - Chocolate Chip Cookies The Chapter Problem for...Ch. 6.3 - Quarters After 1964, quarters were manufactured so...Ch. 6.3 - Large Data Sets. In Exercises 33 and 34, refer to...Ch. 6.3 - Prob. 34BSCCh. 6.3 - Curving Test Scores A statistics professor gives a...Ch. 6.3 - Using Continuity Correction There are many...Ch. 6.3 - Prob. 37BBCh. 6.3 - SAT and ACT Tests Based on recent results, scores...Ch. 6.4 - Minting Quarters In a recent year, the U.S. Mint...Ch. 6.4 - Sampling with Replacement In a recent year, the...Ch. 6.4 - Unbiased Estimators Data Set 1 in Appendix B...Ch. 6.4 - Prob. 4BSCCh. 6.4 - Prob. 5BSCCh. 6.4 - Prob. 6BSCCh. 6.4 - Prob. 7BSCCh. 6.4 - In Exercises 710, use the same population of {4,...Ch. 6.4 - In Exercises 710, use the same population of {4,...Ch. 6.4 - Prob. 10BSCCh. 6.4 - In Exercises 1114, use the population of ages {56,...Ch. 6.4 - In Exercises 1114, use the population of ages {56,...Ch. 6.4 - In Exercises 1114, use the population of ages {56,...Ch. 6.4 - Prob. 14BSCCh. 6.4 - Births: Sampling Distribution of Sample Proportion...Ch. 6.4 - Births: Sampling Distribution of Sample Proportion...Ch. 6.4 - SAT and ACT Tests Because they enable efficient...Ch. 6.4 - Quality Control After constructing a new...Ch. 6.4 - Prob. 19BBCh. 6.4 - Prob. 20BBCh. 6.5 - Standard Error of the Mean The population of...Ch. 6.5 - Small Sample Heights of adult females are normally...Ch. 6.5 - Notation The population of distances that adult...Ch. 6.5 - Prob. 4BSCCh. 6.5 - Using the Central Limit Theorem. In Exercises 510,...Ch. 6.5 - Using the Central Limit Theorem. In Exercises 510,...Ch. 6.5 - Using the Central Limit Theorem. In Exercises 510,...Ch. 6.5 - Using the Central Limit Theorem. In Exercises 510,...Ch. 6.5 - Using the Central Limit Theorem. In Exercises 510,...Ch. 6.5 - Using the Central Limit Theorem. In Exercises 510,...Ch. 6.5 - Prob. 11BSCCh. 6.5 - Prob. 12BSCCh. 6.5 - Designing Hats Women have head circumferences that...Ch. 6.5 - Designing Manholes According to the website...Ch. 6.5 - Prob. 15BSCCh. 6.5 - Loading MM Packages MM plain candies have a mean...Ch. 6.5 - Prob. 17BSCCh. 6.5 - Pulse Rates of Women Women have pulse rates that...Ch. 6.5 - Redesign of Ejection Seats When women were allowed...Ch. 6.5 - Loading a Tour Boat The Ethan Allen tour boat...Ch. 6.5 - Doorway Height The Boeing 757-200 ER airliner...Ch. 6.5 - Loading Aircraft Before every flight, the pilot...Ch. 6.5 - Prob. 23BBCh. 6.5 - Population Parameters Use the same population of...Ch. 6.6 - Normal Quantile Plot Data Set 1 in Appendix B...Ch. 6.6 - Prob. 2BSCCh. 6.6 - Prob. 3BSCCh. 6.6 - Prob. 4BSCCh. 6.6 - Prob. 5BSCCh. 6.6 - Interpreting Normal Quantile Plots. In Exercises...Ch. 6.6 - Prob. 7BSCCh. 6.6 - Interpreting Normal Quantile Plots. In Exercises...Ch. 6.6 - Prob. 9BSCCh. 6.6 - Determining Normality. In Exercises 912, refer to...Ch. 6.6 - Determining Normality. In Exercises 912, refer to...Ch. 6.6 - Prob. 12BSCCh. 6.6 - Prob. 13BSCCh. 6.6 - Prob. 14BSCCh. 6.6 - Using Technology to Generate Normal Quantile...Ch. 6.6 - Prob. 16BSCCh. 6.6 - Prob. 17BSCCh. 6.6 - Constructing Normal Quantile Plots. In Exercises...Ch. 6.6 - Prob. 19BSCCh. 6.6 - Prob. 20BSCCh. 6.6 - Transformations The heights (in inches) of men...Ch. 6.6 - Earthquake Magnitudes Richter scale earthquake...Ch. 6.6 - Prob. 23BBCh. 6.7 - Exact Value and Approximation Refer to Figure 6-21...Ch. 6.7 - Continuity Correction In a preliminary test of the...Ch. 6.7 - Prob. 3BSCCh. 6.7 - Prob. 4BSCCh. 6.7 - Prob. 5BSCCh. 6.7 - Prob. 6BSCCh. 6.7 - Prob. 7BSCCh. 6.7 - Prob. 8BSCCh. 6.7 - Prob. 9BSCCh. 6.7 - Prob. 10BSCCh. 6.7 - Voters. In Exercises 912, use a normal...Ch. 6.7 - Prob. 12BSCCh. 6.7 - Prob. 13BSCCh. 6.7 - Prob. 14BSCCh. 6.7 - Mendelian Genetics When Mendel conducted his...Ch. 6.7 - Prob. 16BSCCh. 6.7 - XSORT Gender Selection MicroSorts XSORT...Ch. 6.7 - Prob. 18BSCCh. 6.7 - Prob. 19BSCCh. 6.7 - Cell Phones and Brain Cancer In a study of 420,095...Ch. 6.7 - Prob. 21BSCCh. 6.7 - Prob. 22BSCCh. 6.7 - Prob. 23BSCCh. 6.7 - Prob. 24BSCCh. 6.7 - Decision Theory Marc Taylor plans to place 200...Ch. 6.7 - Prob. 26BBCh. 6 - Identify the values of and for the standard...Ch. 6 - Bone Density Test. In Exercises 1-4, assume that...Ch. 6 - Prob. 3CQQCh. 6 - Prob. 4CQQCh. 6 - Prob. 5CQQCh. 6 - Prob. 6CQQCh. 6 - In Exercises 6-10, assume that red blood cell...Ch. 6 - Prob. 8CQQCh. 6 - Prob. 9CQQCh. 6 - Prob. 10CQQCh. 6 - Prob. 1RECh. 6 - Prob. 2RECh. 6 - Window Placement Standing eye heights of men are...Ch. 6 - Sampling Distributions Scores on the ACT test have...Ch. 6 - Prob. 5RECh. 6 - Monorail and Airliner Doors The Mark VI monorail...Ch. 6 - Aircraft Safety Standards Under older Federal...Ch. 6 - Assessing Normality Listed below are the current...Ch. 6 - Prob. 9RECh. 6 - Prob. 10RECh. 6 - Miami Heat The following are current annual...Ch. 6 - Prob. 2CRECh. 6 - Birth Weights Birth weights in the United States...Ch. 6 - POTUS The accompanying graph is a histogram of...Ch. 6 - Left-Handedness According to data from the...Ch. 6 - Binomial Probabilities Section 6-7 described a...Ch. 6 - Prob. 1FDDCh. 6 - Prob. 2FDDCh. 6 - Prob. 3FDDCh. 6 - Critical Thinking: Designing aircraft seats When...Ch. 6 - Critical Thinking: Designing aircraft seats When...Ch. 6 - Critical Thinking: Designing aircraft seats When...
Knowledge Booster


Learn more about
Need a deep-dive on the concept behind this application? Look no further. Learn more about this topic, statistics and related others by exploring similar questions and additional content below.Similar questions
- Chapter 6, Section 2-D, Exercise 071 Assume the sample is a random sample from a distribution that is reasonably normally distributed and we are doing inference for a sample mean. Find the area in a t-distribution above 2.3 if the sample has size n=6.Round your answer to three decimal places.area = Enter your answer in accordance to the question statementarrow_forwardUsing the Runs Test for Randomness. In Exercises 5–10, use the runs test with a significance level of α=0.05. (All data are listed in order by row.) Newspapers Media experts claim that daily print newspapers are declining because of Internet access. Listed below are the numbers of daily print newspapers in the United States for a recent sequence of years. First find the median, then test for randomness of the numbers above and below the median. What do the results suggest?arrow_forwardnt: Chapter 5 Assignment Exercise 05.08 Algo (Developing Discrete Probability Distributions) x 1 2 The following data were collected by counting the number of operating rooms in use at Tampa General Hospital over a 20-day period: On three of the days only one operating room was used, on five of the days two were used, on eight of the days three were used, and on four days all four of the hospital's operating rooms were used. Round your answers to two decimal places. a. Use the relative frequency approach to construct an empirical discrete probability distribution for the number of operating rooms in use on any given day. 3 4 f(x) ***** Total b. Select a graph of the probability distribution. 3111 Save hp Assignment Score: 90.35% Submit Assignment for Grading Question 8 of 10 ► Hint(s) Check My Work Sep 17 11:3arrow_forward
- Calculate the relative frequency P(E). You roll two dice 10 times. Both dice show the same number 2 times, and on 3 rolls, exactly one number is odd. E is the event that the sum of the numbers is even. P(E) =arrow_forwardIn Exercises 5–20, assume that the two samples are independent simple random samples selected from normally distributed populations, and do not assume that the population standard deviations are equal. (Note: Answers in Appendix D include technology answers based on Formula 9-1 along with “Table” answers based on Table A-3 with df equal to the smaller of n1 − 1 and n2 − 1.) Is Old Faithful Not Quite So Faithful? Listed below are time intervals (min) between eruptions of the Old Faithful geyser. The “recent” times are within the past few years, and the “past” times are from 1995. Does it appear that the mean time interval has changed? Is the conclusion affected by whether the significance level is 0.05 or 0.01?arrow_forwardExhibit 6-2 The time it takes for a college student to travel between her home and her college is uniformly distributed between 40 and 90 minutes. 3. Refer to Exhibit 6-2. The probability that she will finish her trip in 80 minutes or less is .2 .02 1 .8arrow_forward
- please solve the following The manager of the emergency room (ER) at a large hospital is to count the number of patients arriving at the ER to receive medical attention, per hour. He randomly picks 11 one-hour time intervals, and counts the number of people arriving to receive medical attention in each of these 11 one-hour time intervals.He notices that this count fluctuates from one-hour to the next.Identify the probability model that best models such fluctuations.A. Uniform distributionB. Hypergeometric distributionC. Binomial distributionD. Random distributionE. Poisson distributionF. Bernoulli distributionG. none of the above A lottery consists of picking 5 numbers from 1 to 50, the winner of this lottery has to match all numbers chosen. That is, his/her 5 numbers have to match the 5 numbers taken from 1 to 50.A player of this lottery is to count how many of his/her numbers match the winning 5-number combination.Identify the probability model that best models this count.A.…arrow_forwardPart 1: 1-1. X1, X2, ... is a random sample of N (H, a?), find the distribution of Y = (n-1)s²arrow_forwardThe average age for menopause for women in the UK is 51.21 years. A pharmaceutical company wants to test a new medication to see if it has any effect on the average age of menopause. A random sample of 400 participants who have taken the medication has a mean of 56.45 and standard deviation of 12.6. Did the medication affect menopause? You can use the z-table supplied below. a) ull and alternative hypotheses. b) Calculate the Z score which is required to achieve a confidence level of 95% for a Normal Z ution. At a 95% confidence level, is there enough evidence to support that the medicine works with a significant effect? Express what null and alternative hypothesis are here. You must show your calculation, draw the Z-normal curve and indicate where value of the Z must lie to accept or reject the null hypotheses.arrow_forward
arrow_back_ios
arrow_forward_ios
Recommended textbooks for you
 MATLAB: An Introduction with ApplicationsStatisticsISBN:9781119256830Author:Amos GilatPublisher:John Wiley & Sons Inc
 Probability and Statistics for Engineering and th...StatisticsISBN:9781305251809Author:Jay L. DevorePublisher:Cengage Learning
 Statistics for The Behavioral Sciences (MindTap C...StatisticsISBN:9781305504912Author:Frederick J Gravetter, Larry B. WallnauPublisher:Cengage Learning
 Elementary Statistics: Picturing the World (7th E...StatisticsISBN:9780134683416Author:Ron Larson, Betsy FarberPublisher:PEARSON
 The Basic Practice of StatisticsStatisticsISBN:9781319042578Author:David S. Moore, William I. Notz, Michael A. FlignerPublisher:W. H. Freeman
 Introduction to the Practice of StatisticsStatisticsISBN:9781319013387Author:David S. Moore, George P. McCabe, Bruce A. CraigPublisher:W. H. Freeman
MATLAB: An Introduction with Applications
Statistics
ISBN:9781119256830
Author:Amos Gilat
Publisher:John Wiley & Sons Inc
Probability and Statistics for Engineering and th...
Statistics
ISBN:9781305251809
Author:Jay L. Devore
Publisher:Cengage Learning
Statistics for The Behavioral Sciences (MindTap C...
Statistics
ISBN:9781305504912
Author:Frederick J Gravetter, Larry B. Wallnau
Publisher:Cengage Learning
Elementary Statistics: Picturing the World (7th E...
Statistics
ISBN:9780134683416
Author:Ron Larson, Betsy Farber
Publisher:PEARSON
The Basic Practice of Statistics
Statistics
ISBN:9781319042578
Author:David S. Moore, William I. Notz, Michael A. Fligner
Publisher:W. H. Freeman
Introduction to the Practice of Statistics
Statistics
ISBN:9781319013387
Author:David S. Moore, George P. McCabe, Bruce A. Craig
Publisher:W. H. Freeman
Mod-01 Lec-01 Discrete probability distributions (Part 1); Author: nptelhrd;https://www.youtube.com/watch?v=6x1pL9Yov1k;License: Standard YouTube License, CC-BY
Discrete Probability Distributions; Author: Learn Something;https://www.youtube.com/watch?v=m9U4UelWLFs;License: Standard YouTube License, CC-BY
Probability Distribution Functions (PMF, PDF, CDF); Author: zedstatistics;https://www.youtube.com/watch?v=YXLVjCKVP7U;License: Standard YouTube License, CC-BY
Discrete Distributions: Binomial, Poisson and Hypergeometric | Statistics for Data Science; Author: Dr. Bharatendra Rai;https://www.youtube.com/watch?v=lHhyy4JMigg;License: Standard Youtube License