
Concept explainers
Videos
Skill Practice
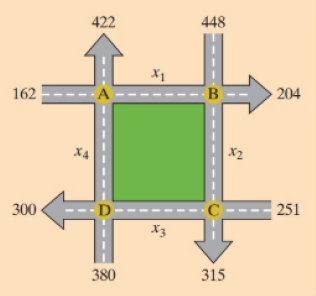
Refer to the figure, Assume that traffic flows freely with flow rates given in vehicles per hour.
a. If the traffic between intersections D and A is 400 vehicles per hour, determine the flow rates
b. If the traffic between intersections D and A is between 380 and 420 vehicles per hour, determine the flow rates
Want to see the full answer?
Check out a sample textbook solution
Chapter 6 Solutions
College Algebra Annotated Instructor's Edition


- Grade Point Average In many universities students are given grade points for each credit unit according to the following scale: A4 points B3 points C2 points D1 points F0 points For example, a grade of A in a 3-unit earns 43=12 grade points and grade points and a grade of B in a 5-unit course earns 35=15 grade points. A student’s grade point average (GPA) for these two courses is the total number of grade points earned divided by the number of units; in this case the GPA is (12+15)/8=3.375 . (a) Find a formula for a GPA of a student who earns a grade A in a units of course work, B in b units; C in c units, D in d units, and F in f units. (b) Find a GPA of a student who has earned a grade of A in two-units courses. B in one 4-unit course, and C in three 3-unit courses.arrow_forwardGrade Point Average In many universities students are given grade points for each credit unit according to the following scale: A 4 points B 3 points C 2 points D 1 point F 0 point For example, a grade of A in a 3-unit course earns 43=12 grade points and a grade of B in a 5-unit course earns 35=15 grade points. A students grade point average GPA for these two courses is the total number of grade points earned divided by the number of units; in this case the GPA is (12+15)8=3.375. a Find a formula for the GPA of a student who earns a grade of A in a units of course work, B in b units, C in c units, D in d units and F in f units. b Find the GPA of a student who has earned a grade of A in two 3-unit courses, B in one 4-unit courses and C in three 3-unit courses.arrow_forwardMarket supply The following table shows the quantity S of wheat, in billions of bushels, that wheat supplies are willing to produce in a year and offer for sale at a price P, in dollars per bushel. S = quantity of wheat P = price 1.0 1.35 1.5 2.40 2.0 3.45 2.5 4.50 In economics, it is customary to plot S on the horizontal axis and P on the vertical axis, so we will think of S as a variable and of P as a function of S. a. Show that these data can be modeled by a linear function, and find its formula. b. Make a graph of the linear formula you found in part a. This is called the market supply curve. c. Explain why the market supply curve should be increasing. Hint: Think about what should happen when the price increases. d. How much wheat would suppliers be willing to produce in a year and offer for sale at a price of 3.90 per bushel?arrow_forward
 Algebra & Trigonometry with Analytic GeometryAlgebraISBN:9781133382119Author:SwokowskiPublisher:Cengage
 Big Ideas Math A Bridge To Success Algebra 1: Stu...AlgebraISBN:9781680331141Author:HOUGHTON MIFFLIN HARCOURTPublisher:Houghton Mifflin Harcourt
 Glencoe Algebra 1, Student Edition, 9780079039897...AlgebraISBN:9780079039897Author:CarterPublisher:McGraw Hill
 Holt Mcdougal Larson Pre-algebra: Student Edition...AlgebraISBN:9780547587776Author:HOLT MCDOUGALPublisher:HOLT MCDOUGAL
 College Algebra (MindTap Course List)AlgebraISBN:9781305652231Author:R. David Gustafson, Jeff HughesPublisher:Cengage Learning
 Functions and Change: A Modeling Approach to Coll...AlgebraISBN:9781337111348Author:Bruce Crauder, Benny Evans, Alan NoellPublisher:Cengage Learning