ELEMENTARY STATISTICS CONNECT CODE>CUS
10th Edition
ISBN: 9781260364323
Author: Bluman
Publisher: MCG CUSTOM
bartleby

Concept explainers

bartleby

Videos

Textbook Question
Book Icon
Chapter 6.3, Problem 1AC

Applying the Concepts 6–3

Times To Travel to School

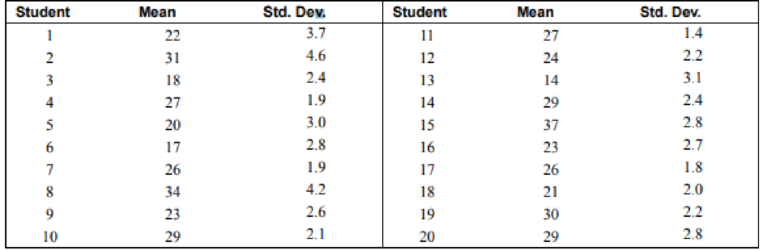
Twenty students from a statistics class each collected a random sample of times on how long it took students to get to class from their homes. All the sample sizes were 30. The resulting means are listed.

Chapter 6.3, Problem 1AC, Applying the Concepts 63 Times To Travel to School Twenty students from a statistics class each

1. The students noticed that everyone had different answers. If you randomly sample over and over from any population, with the same sample size, will the results ever be the same?

2. The students wondered whose results were right. How can they find out what the population mean and standard deviation are?

3. Input the means into the computer and check if the distribution is normal.

4. Check the mean and standard deviation of the means. How do these values compare to the students’ individual scores?

5. Is the distribution of the means a sampling distribution?

6. Check the sampling error for students 3, 7, and 14.

7. Compare the standard deviation of the sample of the 20 means. Is that equal to the standard deviation from student 3 divided by the square of the sample size? How about for student 7, or 14?

See page 368 for the answers.

1.

Expert Solution
Check Mark
To determine

To check: Whether the result will be same when a random sample with same sample size is selected over and over from any population results in same mean.

Answer to Problem 1AC

No, the result will be same when a random sample with same sample size is selected over and over from any population results in same mean.

Explanation of Solution

Given info:

Twenty students each collected a random sample of times on how long it took students to get to class from their homes. Sample size is 30.

Justification:

Since, population is very large, and it’s very rare that the observations in each sample are same or close to each other. Also, it’s very rare event that samples from such a large population have same means. Therefore, the probability that different samples of same size have same means is approximately zero since that event is very rare. Thus, a random sample over and over from any population does not results in same mean.

2.

Expert Solution
Check Mark
To determine

The method to find population mean and population standard deviation.

Answer to Problem 1AC

By taking average of all sample means and standard deviations.

Explanation of Solution

Given info:

Sample means and sample standard deviations of 20 samples.

Justification:

Since, sample means and sample standard deviations are given; therefore population mean can be estimated by taking average of all sample means.

Similarly, population standard deviation can be estimated by taking average of all given standard deviations.

3.

Expert Solution
Check Mark
To determine

Whether the distribution is normal or not.

Answer to Problem 1AC

Given data is not normal.

Explanation of Solution

Given info:

Means of 30 samples are given.

Table:

StudentsAverage time
122
231
318
427
520
617
726
834
923
1029
1127
1224
1314
1429
1537
1623
1726
1821
1930
2029

Software procedure:

Step-by-step procedure to obtain the histogram using the MINITAB software:

  • Enter the given data in columns.
  • Choose Graph > select Histogram > select with fit > select ok.
  • Select the column of average time.
  • Click OK.

Output using the MINITAB software is given below:

ELEMENTARY STATISTICS CONNECT CODE>CUS, Chapter 6.3, Problem 1AC , additional homework tip  1

From MINITAB output, the data of 20 means is not normal but is highly negatively skewed.

4.

Expert Solution
Check Mark
To determine

To find the mean and standard deviation of the sample means.

Answer to Problem 1AC

Mean and standard deviation of sample means is 25.4 and 5.8 resp.

Explanation of Solution

Given info:

Sample means and sample standard deviations of 20 samples of size 30 each are given in table.

Table:

StudentsAverage timeStandard deviation
1223.7
2314.6
3182.4
4271.9
5203
6172.8
7261.9
8344.2
9232.6
10292.1
11271.4
12242.2
13143.1
14292.4
15372.8
16232.7
17261.8
18212
19302.2
20292.8

Software procedure:

Step-by-step procedure to obtain the probability using the MINITAB software:

  • Choose Stat > Basic Statistics > Display Descriptive Statistics.
  • In Variables enter the columns Average time and StDev.
  • Click OK.

Statistics

ELEMENTARY STATISTICS CONNECT CODE>CUS, Chapter 6.3, Problem 1AC , additional homework tip  2

5.

Expert Solution
Check Mark
To determine

Whether distribution of means is sampling distribution.

Answer to Problem 1AC

No.

Explanation of Solution

Given info:

Sample means and sample standard deviations of 20 samples of size 30 each.

Justification:

In given question each sample size is 30. Sampling distribution means that distribution of all possible samples of size 30 from the population. But, there are only 20 samples which are very less. Therefore, distribution of given sample means is not a sampling distribution.

6.

Expert Solution
Check Mark
To determine

the standard error for 3rd, 7th and 14th students.

Answer to Problem 1AC

Standard errors of 3rd, 7th and 14th students are −7.4, 0.6 and 3.6 respectively.

Explanation of Solution

Given info:

Sample means for 3rd, 7th and 14th students are 18, 26, 29 respectively.

From part 4, mean of sample means is 25.4.

Calculation:

Let,

S represents mean of sample means.

S3 represents mean corresponding to 3rd student.

S7 represents mean corresponding to 7th student.

S14 represents mean corresponding to14th student.

Standarderrorofxthstudent=MeanforxthstudentMeanofsamplemeansS3=1825.4=7.4

Similarly,

S7=2625.4=0.6S14=2925.4=3.6

The standard errors of 3rd, 7th and 14th students are −7.4, 0.6 and 3.6 respectively.

7.

Expert Solution
Check Mark
To determine

Compare the standard deviation for 3rd, 7th and 14th students divided by sample size 30 with standard deviations of means.

Answer to Problem 1AC

Standard deviation of means is greater than standard deviation divided by square root of the sample size.

Explanation of Solution

Given Info:

Sample deviations for 3rd, 7th and 14th students.

From part 4, standard deviation of sample means is 5.8.

Sample size is 30.

Calculation:

SD represents the standard deviation of sample means.

SD3 represents the value obtained by dividing standard deviation of 3rd student divided by sample size.

SD7 represents the value obtained by dividing standard deviation of 7th student divided by sample size.

SD14 represents the value obtained by dividing standard deviation of 14th student divided by sample size.

SD=5.8SD3=Standarddeviationfor3rdstudent30=2.430=0.44

 So, SD3 is less than SD

SD7=Standarddeviationfor7thstudent30=1.930=0.35

So, SD7 is less than SD.

SD14=Standarddeviationfor14thstudent30=2.430=0.44

So, SD14 is less than SD.

Therefore, the standard deviations for 3rd, 7th and 14th student divided by sample sizes are less than the standard deviation of means.

Moreover, the standard deviation of means is greater than standard deviation divided by square root of the sample size.

Want to see more full solutions like this?

Subscribe now to access step-by-step solutions to millions of textbook problems written by subject matter experts!

Chapter 6 Solutions

ELEMENTARY STATISTICS CONNECT CODE>CUS

Ch. 6.1 - For Exercises 7 through 26, find the area under...Ch. 6.1 - For Exercises 7 through 26, find the area under...Ch. 6.1 - For Exercises 7 through 26, find the area under...Ch. 6.1 - For Exercises 7 through 26, find the area under...Ch. 6.1 - For Exercises 7 through 26, find the area under...Ch. 6.1 - For Exercises 7 through 26, find the area under...Ch. 6.1 - For Exercises 7 through 26, find the area under...Ch. 6.1 - For Exercises 7 through 26, find the area under...Ch. 6.1 - For Exercises 7 through 26, find the area under...Ch. 6.1 - For Exercises 7 through 26, find the area under...Ch. 6.1 - For Exercises 7 through 26, find the area under...Ch. 6.1 - For Exercises 7 through 26, find the area under...Ch. 6.1 - For Exercises 7 through 26, find the area under...Ch. 6.1 - For Exercises 7 through 26, find the area under...Ch. 6.1 - For Exercises 7 through 26, find the area under...Ch. 6.1 - For Exercises 7 through 26, find the area under...Ch. 6.1 - For Exercises 7 through 26, find the area under...Ch. 6.1 - In Exercises 27 through 40, find the probabilities...Ch. 6.1 - In Exercises 27 through 40, find the probabilities...Ch. 6.1 - In Exercises 27 through 40, find the probabilities...Ch. 6.1 - In Exercises 27 through 40, find the probabilities...Ch. 6.1 - In Exercises 27 through 40, find the probabilities...Ch. 6.1 - In Exercises 27 through 40, find the probabilities...Ch. 6.1 - In Exercises 27 through 40, find the probabilities...Ch. 6.1 - In Exercises 27 through 40, find the probabilities...Ch. 6.1 - In Exercises 27 through 40, find the probabilities...Ch. 6.1 - In Exercises 27 through 40, find the probabilities...Ch. 6.1 - In Exercises 27 through 40, find the probabilities...Ch. 6.1 - In Exercises 27 through 40, find the probabilities...Ch. 6.1 - In Exercises 27 through 40, find the probabilities...Ch. 6.1 - In Exercises 27 through 40, find the probabilities...Ch. 6.1 - For Exercises 41 through 46, find the z value that...Ch. 6.1 - For Exercises 41 through 46, find the z value that...Ch. 6.1 - For Exercises 41 through 46, find the z value that...Ch. 6.1 - For Exercises 41 through 46, find the z value that...Ch. 6.1 - For Exercises 41 through 46, find the z value that...Ch. 6.1 - For Exercises 41 through 46, find the z value that...Ch. 6.1 - Find the z value to the left of the mean so that...Ch. 6.1 - Find the z value to the right of the mean so that...Ch. 6.1 - Find two z values, one positive and one negative,...Ch. 6.1 - Find two z values so that 48% of the middle area...Ch. 6.1 - Prob. 51ECCh. 6.1 - Prob. 52ECCh. 6.1 - Prob. 53ECCh. 6.1 - For Exercises 5356, z0 is the statistical notation...Ch. 6.1 - Prob. 55ECCh. 6.1 - Prob. 56ECCh. 6.1 - Prob. 57ECCh. 6.1 - Prob. 58ECCh. 6.1 - Prob. 59ECCh. 6.1 - Find P(z 2.3 and z 1.2).Ch. 6.2 - Applying the Concepts 62 Smart People Assume you...Ch. 6.2 - Automobile Workers A worker in the automobile...Ch. 6.2 - Teachers Salaries The average annual salary for...Ch. 6.2 - Population in U.S. Jails The average daily jail...Ch. 6.2 - SAT Scores The national average SAT score (for...Ch. 6.2 - Chocolate Bar Calories The average number of...Ch. 6.2 - Monthly Mortgage Payments The average monthly...Ch. 6.2 - Prison Sentences The average prison sentence for a...Ch. 6.2 - Doctoral Student Salaries Full-time Ph.D. students...Ch. 6.2 - Miles Driven Annually The mean number of miles...Ch. 6.2 - Commute Time to Work The average commute to work...Ch. 6.2 - Credit Card Debt The average credit card debt for...Ch. 6.2 - Price of Gasoline The average retail price of...Ch. 6.2 - Potholes The average number of potholes per 10...Ch. 6.2 - Newborn Elephant Weights Newborn elephant calves...Ch. 6.2 - Heart Rates For a certain group of individuals,...Ch. 6.2 - Salary of Full Professors The average salary of a...Ch. 6.2 - Cat Behavior A report stated that the average...Ch. 6.2 - Itemized Charitable Contributions The average...Ch. 6.2 - New Home Sizes A contractor decided to build homes...Ch. 6.2 - New-Home Prices If the average price of a new...Ch. 6.2 - Cost of Personal Computers The average price of a...Ch. 6.2 - Reading Improvement Program To help students...Ch. 6.2 - Qualifying Test Scores To qualify for a medical...Ch. 6.2 - Ages of Amtrak Passenger Cars The average age of...Ch. 6.2 - Lengths of Hospital Stays The average length of a...Ch. 6.2 - High School Competency Test A mandatory competency...Ch. 6.2 - Product Marketing An advertising company plans to...Ch. 6.2 - Bottled Drinking Water Americans drank an average...Ch. 6.2 - Wristwatch Lifetimes The mean lifetime of a...Ch. 6.2 - Police Academy Acceptance Exams To qualify for a...Ch. 6.2 - In the distributions shown, state the mean and...Ch. 6.2 - SAT Scores Suppose that the mathematics SAT scores...Ch. 6.2 - Temperatures for Pittsburgh The mean temperature...Ch. 6.2 - Standardizing If a distribution of raw scores were...Ch. 6.2 - Social Security Payments Consider the distribution...Ch. 6.2 - Find the Mean In a normal distribution, find when...Ch. 6.2 - Internet Users U.S. internet users spend an...Ch. 6.2 - Exam Scores An instructor gives a 100-point...Ch. 6.2 - Drive-in Movies The data shown represent the...Ch. 6.2 - Prob. 40ECh. 6.2 - Prob. 41ECh. 6.2 - Prob. 42ECh. 6.2 - Prob. 43ECh. 6.3 - Applying the Concepts 63 Times To Travel to School...Ch. 6.3 - Prob. 1ECh. 6.3 - Why do most of the sample means differ somewhat...Ch. 6.3 - What is the mean of the sample means?Ch. 6.3 - What is the standard deviation of the sample means...Ch. 6.3 - What does the central limit theorem say about the...Ch. 6.3 - What formula is used to gain information about an...Ch. 6.3 - Life of Smoke Detectors The average lifetime of...Ch. 6.3 - Glass Garbage Generation A survey found that the...Ch. 6.3 - New Residences The average number of moves a...Ch. 6.3 - Teachers Salaries in Connecticut The average...Ch. 6.3 - Earthquakes The average number of earthquakes that...Ch. 6.3 - Teachers Salaries in North Dakota The average...Ch. 6.3 - Movie Ticket Prices In the second quarter of 2015,...Ch. 6.3 - SAT Scores The national average SAT score (for...Ch. 6.3 - Cost of Overseas Trip The average overseas trip...Ch. 6.3 - Cell Phone Lifetimes A recent study of the...Ch. 6.3 - Water Use The Old Farmers Almanac reports that the...Ch. 6.3 - Medicare Hospital Insurance The average yearly...Ch. 6.3 - Amount of Laundry Washed Each Year Procter Gamble...Ch. 6.3 - Per Capita Income of Delaware Residents In a...Ch. 6.3 - Monthly Precipitation for Miami The mean...Ch. 6.3 - Systolic Blood Pressure Assume that the mean...Ch. 6.3 - Cholesterol Content The average cholesterol...Ch. 6.3 - Ages of Proofreaders At a large publishing...Ch. 6.3 - TIMSS Test On the Trends in International...Ch. 6.3 - Life Expectancies In a study of the life...Ch. 6.3 - Home Values A study of 800 homeowners in a certain...Ch. 6.3 - Breaking Strength of Steel Cable The average...Ch. 6.3 - Prob. 29ECCh. 6.3 - Prob. 30ECCh. 6.4 - Applying the Concepts 64 Mountain Climbing Safety...Ch. 6.4 - Explain why a normal distribution can be used as...Ch. 6.4 - What conditions must be met to use the normal...Ch. 6.4 - Why is a correction for continuity necessary?Ch. 6.4 - When is the normal distribution not a good...Ch. 6.4 - Check each binomial distribution to see whether it...Ch. 6.4 - Check each binomial distribution to see whether it...Ch. 6.4 - Single Americans In a recent year, about 22% of...Ch. 6.4 - School Enrollment Of all 3- to 5-year-old...Ch. 6.4 - Home Ownership In a recent year, the rate of U.S....Ch. 6.4 - Mail Order A mail order company has an 8% success...Ch. 6.4 - Small Business Owners Seventy-six percent of small...Ch. 6.4 - Selected Technologies According to the World...Ch. 6.4 - Back Injuries Twenty-two percent of work injuries...Ch. 6.4 - Population of College Cities College students...Ch. 6.4 - Mistakes in Restaurant Bills About 12.5% of...Ch. 6.4 - Internet Browsers The top web browser in 2015 was...Ch. 6.4 - Female Americans Who Have Completed 4 Years of...Ch. 6.4 - Prob. 20ECh. 6.4 - Elementary School Teachers Women comprise 80.3% of...Ch. 6.4 - Prob. 22ECh. 6.4 - Prob. 23ECCh. 6 - Find the area under the standard normal...Ch. 6 - Find the area under the standard normal...Ch. 6 - Using the standard normal distribution, find each...Ch. 6 - Using the standard normal distribution, find each...Ch. 6 - Per Capita Spending on Health Care The average per...Ch. 6 - Salaries for Actuaries The average salary for...Ch. 6 - Commuter Train Passengers On a certain run of a...Ch. 6 - Monthly Spending for Paging and Messaging Services...Ch. 6 - Cost of Smartphone Repair The average cost of...Ch. 6 - Slot Machine Earnings The average amount a slot...Ch. 6 - Private Four-Year College Enrollment A random...Ch. 6 - Heights of Active Volcanoes The heights (in feet...Ch. 6 - Confectionary Products Americans ate an average of...Ch. 6 - Average Precipitation For the first 7 months of...Ch. 6 - Sodium in Frozen Food The average number of...Ch. 6 - Wireless Sound System Lifetimes A recent study of...Ch. 6 - Retirement Income Of the total population of...Ch. 6 - Slot Machines The probability of winning on a slot...Ch. 6 - Multiple-Job Holders According to the government,...Ch. 6 - Enrollment in Personal Finance Course In a large...Ch. 6 - U.S. Population Of the total U.S. population, 37%...Ch. 6 - Larceny-Thefts Excluding motor vehicle thefts, 26%...Ch. 6 - Determine whether each statement is true or false....Ch. 6 - Prob. 2CQCh. 6 - Determine whether each statement is true or false....Ch. 6 - The z value corresponding to a number below the...Ch. 6 - Determine whether each statement is true or false....Ch. 6 - Prob. 6CQCh. 6 - Select the best answer. 7. The mean of the...Ch. 6 - Approximately what percentage of normally...Ch. 6 - Which is not a property of the standard normal...Ch. 6 - When a distribution is positively skewed, the...Ch. 6 - Prob. 11CQCh. 6 - Complete the following statements with the best...Ch. 6 - The difference between a sample mean and a...Ch. 6 - The mean of the sample means equals ________.Ch. 6 - The standard deviation of all possible sample...Ch. 6 - The normal distribution can be used to approximate...Ch. 6 - Prob. 17CQCh. 6 - Find the area under the standard normal...Ch. 6 - Using the standard normal distribution, find each...Ch. 6 - Amount of Rain in a City The average amount of...Ch. 6 - Heights of People The average height of a certain...Ch. 6 - Sports Drink Consumption The average number of...Ch. 6 - Years to Complete a Graduate Program The average...Ch. 6 - Passengers on a Bus On the daily run of an express...Ch. 6 - Thickness of Library Books The average thickness...Ch. 6 - Prob. 26CQCh. 6 - Prob. 27CQCh. 6 - Electric Bills The average electric bill in a...Ch. 6 - Sleep Survey According to a recent survey, 38% of...Ch. 6 - Prob. 30CQCh. 6 - Household Online Connection The percentage of U.S....Ch. 6 - Prob. 32CQCh. 6 - Prob. 33CQCh. 6 - GMAT Scores The average GMAT scores for the top-30...Ch. 6 - Prob. 1CTCCh. 6 - Sometimes a researcher must decide whether a...Ch. 6 - Prob. 3CTCCh. 6 - Prob. 4CTCCh. 6 - Sometimes a researcher must decide whether a...Ch. 6 - Prob. 6CTCCh. 6 - Formulas Confirm the two formulas hold true for...
Knowledge Booster
Background pattern image
Statistics
Learn more about
Need a deep-dive on the concept behind this application? Look no further. Learn more about this topic, statistics and related others by exploring similar questions and additional content below.
Recommended textbooks for you
Text book image
Algebra & Trigonometry with Analytic Geometry
Algebra
ISBN:9781133382119
Author:Swokowski
Publisher:Cengage
Text book image
Glencoe Algebra 1, Student Edition, 9780079039897...
Algebra
ISBN:9780079039897
Author:Carter
Publisher:McGraw Hill
Text book image
Algebra and Trigonometry (MindTap Course List)
Algebra
ISBN:9781305071742
Author:James Stewart, Lothar Redlin, Saleem Watson
Publisher:Cengage Learning
Text book image
Holt Mcdougal Larson Pre-algebra: Student Edition...
Algebra
ISBN:9780547587776
Author:HOLT MCDOUGAL
Publisher:HOLT MCDOUGAL
Text book image
College Algebra (MindTap Course List)
Algebra
ISBN:9781305652231
Author:R. David Gustafson, Jeff Hughes
Publisher:Cengage Learning
Hypothesis Testing - Solving Problems With Proportions; Author: The Organic Chemistry Tutor;https://www.youtube.com/watch?v=76VruarGn2Q;License: Standard YouTube License, CC-BY
Hypothesis Testing and Confidence Intervals (FRM Part 1 – Book 2 – Chapter 5); Author: Analystprep;https://www.youtube.com/watch?v=vth3yZIUlGQ;License: Standard YouTube License, CC-BY