
Concept explainers
Videos
Future scientists: Education professionals refer to science, technology, engineering, and mathematics as the STEM disciplines. The Alliance for Science and Technology Research in America reported in a recent year that 28% of freshmen entering college planned to major in a STEM discipline. A random sample of 85 freshmen is selected.
- a. Is it appropriate to use the normal approximation to find the
probability that less than 30% of the freshmen in the sample are planning to major in a STEM discipline? If so, find the probability. If not, explain why not. - b. A new sample of 150 freshmen is selected. Find the probability that less than 30% of the freshmen in this sample are planning to major in a STEM discipline.
- c. Find the probability that the proportion of freshmen in the sample of 150 who plan to major in a STEM discipline is between 0.30 and 0.35.
- d. Find the probability that more than 32% of the freshmen in the sample of 150 are planning to major in a STEM discipline.
- e. Would it be unusual if less than 25% of the freshmen in the sample of 150 were planning to major in a STEM discipline?
a.
Check whether it is appropriate to use the normal approximation to find the probability that less than 30% of the freshmen in the sample are planning to major in a STEM discipline if it is appropriate find the probability and if not explain the reason.
Answer to Problem 21E
Yes, it is appropriate to use the normal approximation.
The probability that less than 30% of the freshmen in the sample are planning to major in a STEM discipline is 0.6593.
Explanation of Solution
Calculation:
The given information is that 28% of freshmen entering college planned to major in a STEM discipline. A random sample of 85 freshmen is considered.
Central Limit Theorem of proportions:
If
From the given information, the probability of freshmen entering college planned to major in a STEM discipline is 0.28
Requirement check:
Condition 1:
Condition 2:
Condition 1:
Substitute 85 for n and 0.28 for p in np,
Thus, the requirement
Condition 2:
Substitute 85 for n and 0.28 for p in
Thus, the requirement of
Since the both requirements are satisfied. Thus, it is appropriate to use the normal approximation.
Hence, the normal approximation is appropriate to use for finding the probability that less than 30% of the freshmen in the sample are planning to major in a STEM discipline.
For mean
Substitute
Thus, the value of
For standard deviation
Substitute
Thus, the value of
The probability that less than 30% of the freshmen in the sample are planning to major in a STEM discipline represents the area to the left of 0.30
Software Procedure:
Step by step procedure to find the probability by using MINITAB software is as follows:
- Choose Graph > Probability Distribution Plot > View Probability > OK.
- From Distribution, choose ‘Normal’ distribution.
- Enter Mean as 0.28 and Standard deviation as 0.04870.
- Click the Shaded Area tab.
- Choose X value and Left Tail for the region of the curve to shade.
- Enter the X value as 0.30.
- Click OK.
Output using MINITAB software is as follows:
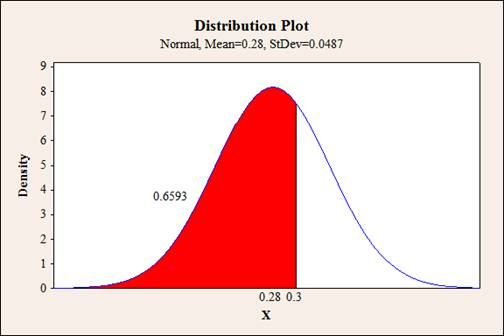
From the output, it can be observed that the probability that less than 30% of the freshmen in the sample are planning to major in a STEM discipline is 0.6593.
b.
Find the probability that less than 30% of the freshmen in the sample are planning to major in a STEM discipline.
Answer to Problem 21E
The probability that less than 30% of the freshmen in the sample are planning to major in a STEM discipline is 0.7073.
Explanation of Solution
Calculation:
The given information is that about 28% of freshmen entering college planned to major in a STEM discipline in the sample of 150 freshmen.
If
Substitute
Thus, the mean
The formula for finding standard deviation
Substitute
Thus, the value of
The probability that less than 30% of the freshmen in the sample are planning to major in a STEM discipline represents the area to the left of 0.30
Software Procedure:
Step by step procedure to find the probability by using MINITAB software is as follows:
- Choose Graph > Probability Distribution Plot > View Probability > OK.
- From Distribution, choose ‘Normal’ distribution.
- Enter Mean as 0.28 and Standard deviation as 0.03666.
- Click the Shaded Area tab.
- Choose X value and Left Tail for the region of the curve to shade.
- Enter the X value as 0.30.
- Click OK.
Output using MINITAB software is as follows:
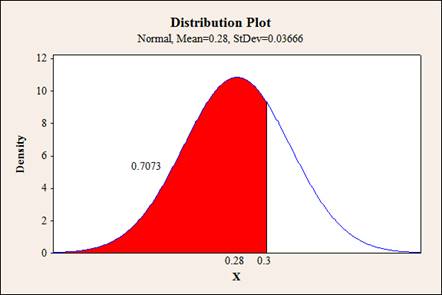
From the output, it can be observed that the probability that less than 30% of the freshmen in the sample are planning to major in a STEM discipline is 0.7073.
c.
Find the probability that the proportion of freshmen in the samples of 150 who plan to major in a STEM discipline is between 0.30 and 0.35.
Answer to Problem 21E
The probability that the proportion of freshmen in the samples of 150 who plan to major in a STEM discipline is between 0.30 and 0.35 is 0.2646.
Explanation of Solution
Calculation:
The probability that the proportion of freshmen in the samples of 150 who plan to major in a STEM discipline is between 0.30 and 0.35 represents the area to the right of 0.30 and the area to the left of 0.35.
Software Procedure:
Step by step procedure to find the probability by using MINITAB software is as follows:
- Choose Graph > Probability Distribution Plot > View Probability > OK.
- From Distribution, choose ‘Normal’ distribution.
- Enter Mean as 0.28 and Standard deviation as 0.03666.
- Click the Shaded Area tab.
- Choose X value and Middle for the region of the curve to shade.
- Enter the X value 1 as 0.30 and X value 2 as 0.35.
- Click OK.
Output using MINITAB software is as follows:
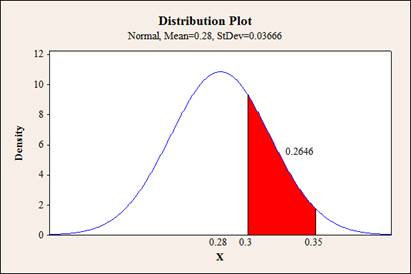
From the output, it can be observed that the probability that the proportion of freshmen in the samples of 150 who plan to major in a STEM discipline is between 0.30 and 0.35 is 0.2646.
d.
Find the probability that more than 32% of the freshmen in the sample of 150 are planning to major in a STEM discipline.
Answer to Problem 21E
The probability that more than 32% of the freshmen in the sample of 150 are planning to major in a STEM discipline is 0.1376.
Explanation of Solution
Calculation:
The probability that more than 32% of the freshmen in the sample of 150 are planning to major in a STEM discipline represents the area to the right of 0.32
Software Procedure:
Step by step procedure to find the probability by using MINITAB software is as follows:
- Choose Graph > Probability Distribution Plot > View Probability > OK.
- From Distribution, choose ‘Normal’ distribution.
- Enter Mean as 0.28 and Standard deviation as 0.03666.
- Click the Shaded Area tab.
- Choose X value and Right Tail for the region of the curve to shade.
- Enter the X value as 0.32.
- Click OK.
Output using MINITAB software is as follows:
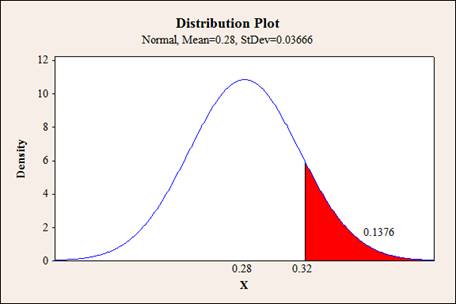
From the output, it can be observed that the probability that more than 32% of the freshmen in the sample of 150 are planning to major in a STEM discipline is 0.1376.
e.
Check whether it is unusual if less than 25% of the freshmen in the sample of 150 were planning to major in a STEM discipline.
Answer to Problem 21E
No, it is not unusual if less than 25% of the freshmen in the sample of 150 were planning to major in a STEM discipline.
Explanation of Solution
Calculation:
Unusual:
If the probability of an event is less than 0.05 then the event is called unusual.
The probability of less than 25% of the freshmen in the sample of 150 were planning to major in a STEM discipline represents the area to the left of 0.25.
Software Procedure:
Step by step procedure to find the probability by using MINITAB software is as follows:
- Choose Graph > Probability Distribution Plot > View Probability > OK.
- From Distribution, choose ‘Normal’ distribution.
- Enter Mean as 0.28 and Standard deviation as 0.03666.
- Click the Shaded Area tab.
- Choose X value and Left Tail for the region of the curve to shade.
- Enter the X value as 0.25.
- Click OK.
Output using MINITAB software is as follows:
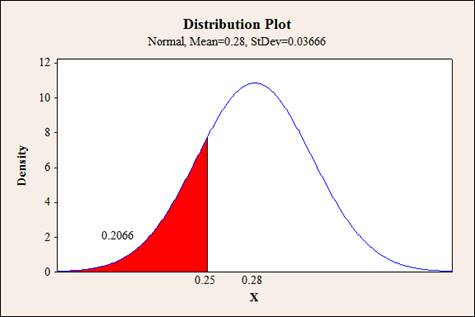
From the output, it can be observed that the probability that less than 25% of the freshmen in the sample of 150 were planning to major in a STEM discipline is 0.2066.
Here, the probability of less than 25% of the freshmen in the sample of 150 were planning to major in a STEM discipline is greater than 0.05. That is,
Want to see more full solutions like this?
Chapter 6 Solutions
Essential Statistics


