
Concept explainers
Videos
Blood pressure: High blood pressure has been identified as a risk factor for heart attacks and strokes. The National Health and Nutrition Examination Survey reported that the proportion of U.S. adults with high blood pressure is 0.3. A sample of 38 U.S. adults is chosen.
- a. Is it appropriate to use the normal approximation to find the
probability that more than 40% of the people in the sample have high blood pressure? If so, find the probability. If not, explain why not. - b. A new sample of 80 adults is drawn. Find the probability that more than 40% of the people in this sample have high blood pressure.
- c. Find the probability that the proportion of individuals in the sample of 80 who have high blood pressure is between 0.20 and 0.35.
- d. Find the probability that less than 25% of the people in the sample of 80 have high blood pressure.
- e. Would it be unusual if more than 45% of the individuals in the sample of 80 had high blood pressure?
a.
Check whether it is appropriate to use the normal approximation to find the probability that more than 40% of the people in the sample have high blood pressure and if it is appropriate find the probability, if not explain the reason.
Answer to Problem 22E
Yes, it is appropriate to use the normal approximation.
The probability that more than 40% of the people in the sample have high blood pressure is 0.0893.
Explanation of Solution
Calculation:
The given information is that the sample of U.S. adults chosen (n) is 38 and the proportion of U.S. adults with high blood pressure (p) is 0.3.
Central Limit Theorem of proportions:
If
Requirement check:
Condition 1:
Condition 2:
Condition 1:
Substitute 38 for n and 0.3 for p in np,
Thus, the requirement
Condition 2:
Substitute 38 for n and 0.3 for p in
Thus, the requirement of
Here, both the requirements are satisfied. Thus, it is appropriate to use the normal approximation.
Hence, the normal approximation is appropriate to use for finding the probability that more than 40% of the people in the sample have high blood pressure.
For mean
Substitute
Thus, the value of
For standard deviation
Substitute
Thus, the value of
The probability that more than 40% of the people in the sample have high blood pressure represents the area to the right of 0.40
Software Procedure:
Step by step procedure to find the probability by using MINITAB software is as follows:
- Choose Graph > Probability Distribution Plot > View Probability > OK.
- From Distribution, choose ‘Normal’ distribution.
- Enter Mean as 0.3 and Standard deviation as 0.07434.
- Click the Shaded Area tab.
- Choose X value and Right Tail for the region of the curve to shade.
- Enter the X value as 0.40.
- Click OK.
Output using MINITAB software is as follows:
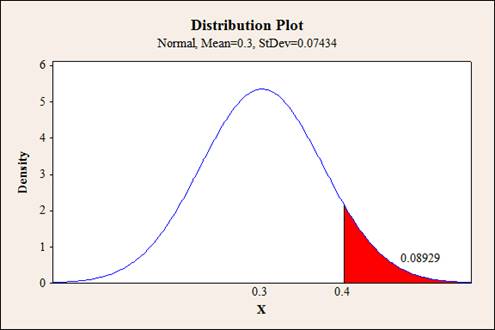
From the output, it can be observed that the probability that more than 40% of the people in the sample have high blood pressure is approximately 0.0893.
b.
Find the probability that more than 40% of the people in the sample have high blood pressure.
Answer to Problem 22E
The probability that more than 40% of the people in the sample have high blood pressure is 0.0255.
Explanation of Solution
Calculation:
The given information is that the sample of U.S. adults is chosen (n) is 80 and the proportion of U.S. adults with high blood pressure (p) is 0.3.
If
Substitute
Thus, the mean
The formula for finding standard deviation
Substitute
Thus, the value of
The probability that more than 40% of the people in the sample have high blood pressure represents the area to the right of 0.40
Software Procedure:
Step by step procedure to find the probability by using MINITAB software is as follows:
- Choose Graph > Probability Distribution Plot > View Probability > OK.
- From Distribution, choose ‘Normal’ distribution.
- Enter Mean as 0.3 and Standard deviation as 0.05123.
- Click the Shaded Area tab.
- Choose X value and Right Tail for the region of the curve to shade.
- Enter the X value as 0.40.
- Click OK.
Output using MINITAB software is as follows:
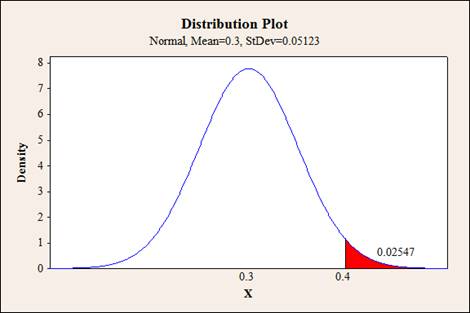
From the output, it can be observed that the probability that more than 40% of the people in the sample have high blood pressure is approximately 0.0255.
c.
Find the probability that the proportion of individuals in the sample of 80 who have high blood pressure is between 0.20 and 0.35.
Answer to Problem 22E
The probability that the proportion of individuals in the sample of 80 who have high blood pressure is between 0.20 and 0.35 is 0.8100.
Explanation of Solution
Calculation:
The probability that the proportion of individuals in the sample of 80 who have high blood pressure is between 0.20 and 0.35 represents the area to the right of 0.20 and the area to the left of 0.35.
Software Procedure:
Step by step procedure to find the probability by using MINITAB software is as follows:
- Choose Graph > Probability Distribution Plot > View Probability > OK.
- From Distribution, choose ‘Normal’ distribution.
- Enter Mean as 0.3 and Standard deviation as 0.05123.
- Click the Shaded Area tab.
- Choose X value and Middle for the region of the curve to shade.
- Enter the X value 1 as 0.20 and X value 2 as 0.35.
- Click OK.
Output using MINITAB software is as follows:
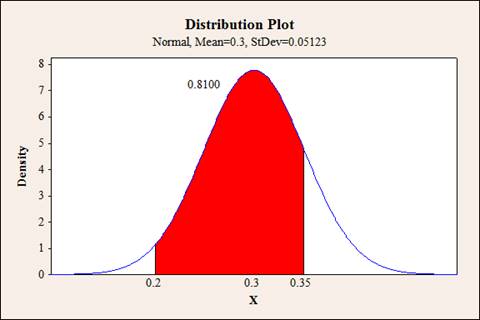
From the output, it can be observed that the probability that the proportion of individuals in the sample of 80 who have high blood pressure is between 0.20 and 0.35 is 0.8100.
d.
Find the probability that less than 25% of the people in the sample of 80 have high blood pressure.
Answer to Problem 22E
The probability that less than 25% of the people in the sample of 80 have high blood pressure is 0.1645.
Explanation of Solution
Calculation:
The probability that less than 25% of the people in the sample of 80 have high blood pressure represents the area to the left of 0.25
Software Procedure:
Step by step procedure to find the probability by using MINITAB software is as follows:
- Choose Graph > Probability Distribution Plot > View Probability > OK.
- From Distribution, choose ‘Normal’ distribution.
- Enter Mean as 0.3 and Standard deviation as 0.05123.
- Click the Shaded Area tab.
- Choose X value and Left Tail for the region of the curve to shade.
- Enter the X value as 0.25.
- Click OK.
Output using MINITAB software is as follows:
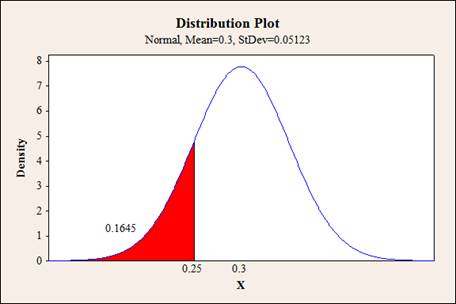
From the output, it can be observed that the probability that less than 25% of the people in the sample of 80 have high blood pressure is 0.1645.
e.
Check whether it is unusual if more than 45% of the individuals in the sample of 80 had high blood pressure.
Answer to Problem 22E
Yes, it is unusual if more than 45% of the individuals in the sample of 80 had high blood pressure.
Explanation of Solution
Calculation:
Unusual:
If the probability of an event is less than 0.05 then the event is called unusual.
The probability of more than 45% of the individuals in the sample of 80 had high blood pressure represents the area to the right of 0.45.
Software Procedure:
Step by step procedure to find the probability by using MINITAB software is as follows:
- Choose Graph > Probability Distribution Plot > View Probability > OK.
- From Distribution, choose ‘Normal’ distribution.
- Enter Mean as 0.3 and Standard deviation as 0.05123.
- Click the Shaded Area tab.
- Choose X value and Right Tail for the region of the curve to shade.
- Enter the X value as 0.45.
- Click OK.
Output using MINITAB software is as follows:
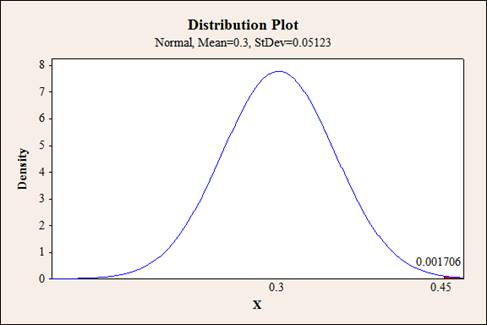
From the output, it can be observed that the probability of more than 45% of the individuals in the sample of 80 had high blood pressure is approximately 0.0017.
Here, the probability of more than 45% of the individuals in the sample of 80 had high blood pressure is less than 0.05. That is,
Want to see more full solutions like this?
Chapter 6 Solutions
Essential Statistics


