a.
To find: The probability that the sample mean cost for 36 randomly selected schools less than $25,000.
a.
Answer to Problem 9E
The probability that the sample mean cost for 36 randomly selected schools less than $25,000 is 0.0026.
Explanation of Solution
Given info:
The costs for tuition, fees, room and board for four-year institutions follows
Calculations:
The random variable x represents costs.
The notation
The formula for finding the z score using central limit theorem is,
Substitute 25,000 for
The probability that the sample mean cost for 36 randomly selected schools less than $25,000 is obtained by finding the area to the left of –2.79.
Software procedure:
Step-by-step procedure to obtain the probability using the MINITAB software:
- Choose Graph > Probability Distribution Plot choose View Probability> OK.
- From Distribution, choose ‘Normal’ distribution.
- Enter the Mean as 0.0 and Standard deviation as 1.0.
- Click the Shaded Area tab.
- Choose X value and Left Tail for the region of the curve to shade.
- Enter the X value as –2.79.
- Click OK.
Output using the MINITAB software is given below:
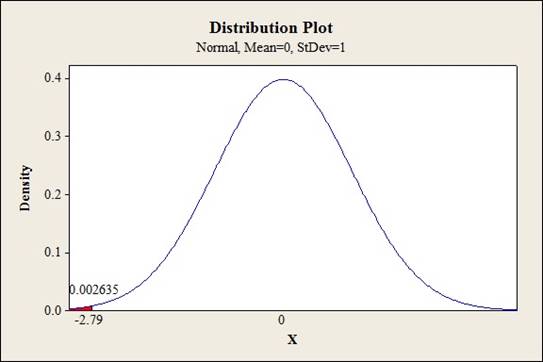
From MINITAB, the probability that the sample mean cost for 36 randomly selected schools less than $25,000 is 0.0026.
b.
To find: The probability that the sample mean cost for 36 randomly selected schools greater than $26,000.
b.
Answer to Problem 9E
The probability that the sample mean cost for 36 randomly selected schools greater than $26,000 is 0.8212.
Explanation of Solution
Calculations:
The random variable x represents costs.
The notation
The formula for finding the z score using central limit theorem is,
Substitute 26,000 for
The probability that the sample mean cost for 36 randomly selected schools greater than $26,000 is obtained by finding the area to the left of –0.92.
Software procedure:
Step-by-step procedure to obtain the probability using the MINITAB software:
- Choose Graph > Probability Distribution Plot choose View Probability> OK.
- From Distribution, choose ‘Normal’ distribution.
- Enter the Mean as 0.0 and Standard deviation as 1.0.
- Click the Shaded Area tab.
- Choose X value and Right Tail for the region of the curve to shade.
- Enter the X value as –0.92.
- Click OK.
Output using the MINITAB software is given below:
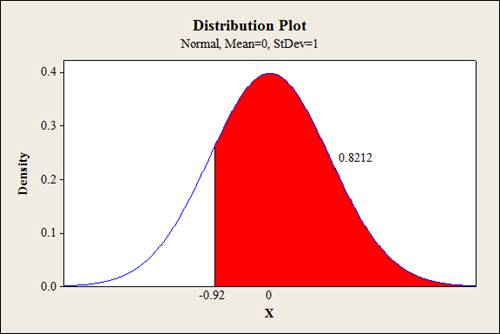
From MINITAB, the probability that the sample mean cost for 36 randomly selected schools greater than $26,000 is 0.8212.
c.
To find: The probability that the sample mean cost for 36 randomly selected schools between $24,000 and $26,000.
c.
Answer to Problem 9E
The probability that the sample mean cost for 36 randomly selected schools between $24,000 and $26,000 is 0.1788.
Explanation of Solution
Calculations:
The random variable x represents costs.
The notation
The formula for finding the z score using central limit theorem is,
For 24,000:
Substitute 24,000 for
For 26,000:
Substitute 26,000 for
The probability that the sample mean cost for 36 randomly selected schools between $24,000 and $26,000 represents the area between –4.66 and –0.92.
Software procedure:
Step-by-step procedure to obtain the probability using the MINITAB software:
- Choose Graph > Probability Distribution Plot choose View Probability> OK.
- From Distribution, choose ‘Normal’ distribution.
- Enter the Mean as 0.0 and Standard deviation as 1.0.
- Click the Shaded Area tab.
- Choose X value and Middle for the region of the curve to shade.
- Enter the X value 1 as –4.66 and X value 2 as –0.92.
- Click OK.
Output using the MINITAB software is given below:
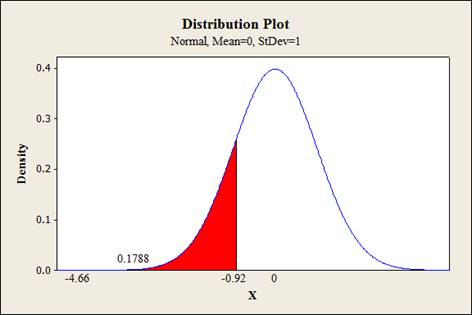
From MINITAB, the probability that the sample mean cost for 36 randomly selected schools between $24,000 and $26,000 is 0.1788.
Want to see more full solutions like this?
Chapter 6 Solutions
Elementary Statistics - Formula Card

 MATLAB: An Introduction with ApplicationsStatisticsISBN:9781119256830Author:Amos GilatPublisher:John Wiley & Sons Inc
 Probability and Statistics for Engineering and th...StatisticsISBN:9781305251809Author:Jay L. DevorePublisher:Cengage Learning
 Statistics for The Behavioral Sciences (MindTap C...StatisticsISBN:9781305504912Author:Frederick J Gravetter, Larry B. WallnauPublisher:Cengage Learning
 Elementary Statistics: Picturing the World (7th E...StatisticsISBN:9780134683416Author:Ron Larson, Betsy FarberPublisher:PEARSON
 The Basic Practice of StatisticsStatisticsISBN:9781319042578Author:David S. Moore, William I. Notz, Michael A. FlignerPublisher:W. H. Freeman
 Introduction to the Practice of StatisticsStatisticsISBN:9781319013387Author:David S. Moore, George P. McCabe, Bruce A. CraigPublisher:W. H. Freeman