
Concept explainers
Videos
Milk Production The data in the table below represent the number of dairy farms [in thousands) and the amount of milk produced (in billions of pounds) in the United States for various years.
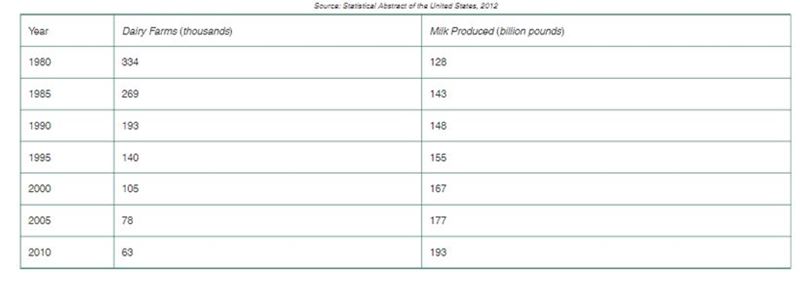
a. Using a graphing utility, draw a
b. Using a graphing utility, build a logarithmic model from the data.
c. Graph the logarithmic function found in part (b) on the scatter diagram.
d. In 2008, there were 67 thousand dairy farms in the United States. Use the function in part(b) to predict the amount of milk produced in 2008.
e. The actual amount of milk produced in 2008 was 190 billion pounds. How does your prediction in pad (d) compare to this?
Want to see the full answer?
Check out a sample textbook solution
Chapter 6 Solutions
College Algebra (10th Edition)
Additional Math Textbook Solutions
Elementary Algebra: Concepts and Applications (10th Edition)
Differential Equations and Linear Algebra (4th Edition)
Elementary Linear Algebra (Classic Version) (2nd Edition) (Pearson Modern Classics for Advanced Mathematics Series)
Intermediate Algebra (12th Edition)
Introduction to Linear Algebra (Classic Version) (5th Edition) (Pearson Modern Classics for Advanced Mathematics Series)
Algebra And Trigonometry (11th Edition)


- What type (s) of translation (s), if any, affect thedomain ofa logarithmic function?arrow_forwardHuman Memory Model Students in a learning theory study took an exam and then retested monthly for 6 months with an equivalent exam. The data obtained in the study are given by the ordered pairs t,s, where t is the time (in months) after the initial exam and s is the average score for the class. Use the data to find a logarithmic equation that relates t and s. 1,84.2,2,78.4,3,72.1,4,68.5,5,67.1,6,65.3arrow_forwardWhat type (s) of translation(s), if any, affect the range of a logarithmic function?arrow_forward
- Age of Haddock The age T, in years, of a haddock can be thought of as a function of its length L, in centimeters. One common model uses the natural logarithm: T=195ln(53L). a.Draw a graph of age versus length . include lengths between 25 and 50 centimeters. b.Using functional notation, express the age of a haddock that is 35 centimeters long, and then calculate that value. c.How long is a haddock that is 10 years old.arrow_forwardSales of a video game released in the year 2000 took off at first, but then steadily slowed as time moved on. Table 4 shows the number of games sold, in thousands, from the years 20002010. a. Let x represent time in years starting with x=1 for the year 2000. Let y represent the number of games sold in thousands. Use logarithmic regression to fit a model to these data. b. If games continue to sell at this rate, how many games will sell in 2015? Round to the nearest thousand.arrow_forwardLogistic Population growth the table and scatter plot give the population of black flies in a closed laboratory container over an 18 day period. (a) Use the logistic command on your calculator to find a logistic model for these data. (b) Use the model to estimate the time when there were 400 flies in the containerarrow_forward
- Calculating Common LogarithmsIn Exercises S-11 through S-14, you are asked to find common logarithms without using your calculator. log1000arrow_forwardWeight Gain Zoologists have studied the daily rate of gain in weight G as a function of daily milk energy intake M during the first month of life in several ungulate that is, hoofed mammal species. Both M and G are measured per unit of mean body weight. They developed the model G=0.067+0.052logM With appropriate units for M and G. a.Draw a graph of G versus M. Include values of M up to 0.4unit. b.If the daily milk-energy intake M is 0.3unit, what is the daily rate of gain in weight? c.A zookeeper wants to bottle-feed an elk calf so as to maintain a daily rate of gain in weight G of 0.3unit. What must the daily milk-energy intake be? d.The study cited above noted that the higher levels of milk ingested per unit of body weight are used with reduced efficiency. Explain how the shape of the graph supports this statement.arrow_forwardBuffalo: Waterton Lakes National Park of Canada, where the Great Plains dramatically meet the Rocky Mountains in Alberta, has a migratory buffalo bison herd that spends falls and winters in the park. The herd is currently managed and so kept small; however, if it were unmanaged and allowed to grow, then the number N of buffalo in the herd could be estimated by the logistic formula N=3151+14e0.23t Here t is the number of years since the beginning of 2002, the first year the herd is unmanaged. a. Make a graph of N versus t covering the next 30 years of the herds existance corresponding to dates up to 2032. b. How many buffalo are in the herd at the beginning of 2002? c. When will the number of buffalo first exceed 300?. d. How many buffalo will there eventually be in the herd? e. When is the graph of N, as a function of t, concave up? When is it concave down? What does this mean in terms of the growth of the buffalo herd?.arrow_forward

 Algebra & Trigonometry with Analytic GeometryAlgebraISBN:9781133382119Author:SwokowskiPublisher:Cengage
 Functions and Change: A Modeling Approach to Coll...AlgebraISBN:9781337111348Author:Bruce Crauder, Benny Evans, Alan NoellPublisher:Cengage Learning
 College AlgebraAlgebraISBN:9781305115545Author:James Stewart, Lothar Redlin, Saleem WatsonPublisher:Cengage Learning
 Trigonometry (MindTap Course List)TrigonometryISBN:9781337278461Author:Ron LarsonPublisher:Cengage Learning