
Concept explainers
Videos
Scores from a questionnaire measuring social anxiety form a
- a. for a random sample of n = 4 people?
- b. for a random sample of n = 16 people?
- c. for a random sample of n = 25 people?
a.
Answer to Problem 11P
The probability of obtaining a sample mean greater than
Explanation of Solution
Given info:
Numbers of people in a random sample are
Population mean is
Population standard deviation is
Sample mean is
Calculation:
If
Let
Let p represents the probability that random mean is greater than
Software procedure:
Step-by-step procedure to obtain the
- Click on first empty block of data view.
- Go to Transform>Choose Compute variable>Enter Probability in Target Variable.
- Choose CDF& Noncentral CDF under Function group> choose CDF.Normal> drag it to the numeric expression.
- Enter 53,50,5 in the braces of CDF.NORMAL
- Choose OK.
Output using the SPSS software is given below:
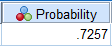
From the SPSS output,
Using
Thus, the probability of obtaining a mean greater than
b.
Answer to Problem 11P
The probability of obtaining a sample mean greater than
Explanation of Solution
Given info:
Numbers of people in a random sample are
Population mean is
Population standard deviation is
Sample mean is
Calculation:
If
Let
Let p represents the probability that random mean is greater than
Software procedure:
Step-by-step procedure to obtain the
- Click on first empty block of data view.
- Go to Transform>Choose Compute variable>Enter Probability in Target Variable.
- Choose CDF& Noncentral CDF under Function group> choose CDF.Normal> drag it to the numeric expression.
- Enter 53,50,2.5 in the braces of CDF.NORMAL
- Choose OK.
Output using the SPSS software is given below:
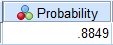
From the SPSS output,
Thus,
Hence, the probability of obtaining a mean greater than
c.
Answer to Problem 11P
The probability of obtaining a sample mean greater than
Explanation of Solution
Given info:
Numbers of people in a random sample are
Population mean is
Population standard deviation is
Sample mean is
Calculation:
If
Let
Let p represents the probability that random mean is greater than
Software procedure:
Step-by-step procedure to obtain the
- Click on first empty block of data view.
- Go to Transform>Choose Compute variable>Enter Probability in Target Variable.
- Choose CDF& Noncentral CDF under Function group> choose CDF.Normal> drag it to the numeric expression.
- Enter 53,50,2 in the braces of CDF.NORMAL
- Choose OK.
Output using the SPSS software is given below:
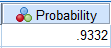
From the SPSS output,
Thus,
Hence, the probability of obtaining a mean greater than
Want to see more full solutions like this?
Chapter 7 Solutions
Essentials of Statistics for The Behavioral Sciences (MindTap Course List)


 MATLAB: An Introduction with ApplicationsStatisticsISBN:9781119256830Author:Amos GilatPublisher:John Wiley & Sons Inc
 Probability and Statistics for Engineering and th...StatisticsISBN:9781305251809Author:Jay L. DevorePublisher:Cengage Learning
 Statistics for The Behavioral Sciences (MindTap C...StatisticsISBN:9781305504912Author:Frederick J Gravetter, Larry B. WallnauPublisher:Cengage Learning
 Elementary Statistics: Picturing the World (7th E...StatisticsISBN:9780134683416Author:Ron Larson, Betsy FarberPublisher:PEARSON
 The Basic Practice of StatisticsStatisticsISBN:9781319042578Author:David S. Moore, William I. Notz, Michael A. FlignerPublisher:W. H. Freeman
 Introduction to the Practice of StatisticsStatisticsISBN:9781319013387Author:David S. Moore, George P. McCabe, Bruce A. CraigPublisher:W. H. Freeman