
Concept explainers
Videos
(a)
Identify the problem based on the parameter being estimated.
Check the sample
Check the sample standard deviation by using the calculator.
(a)
Answer to Problem 13CRP
The problem is categorized as interval for difference in mean based on the parameter being estimated.
Explanation of Solution
Calculation:
The
Hence, the problem is categorized as interval for difference in mean based on the parameter being estimated.
Mean and standard deviation for
Use Ti 83 calculator to find the mean and standard deviation as follows:
- Select STAT > Edit > Enter the values of
- Click
- Click
- Click Enter.
- Click
- Click
- Click Enter.
Output using Ti 83 calculator is given below:
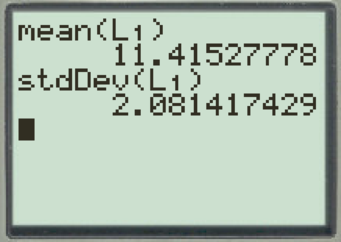
From the Ti 83 calculator output, the mean value is 11.42, and standard deviation value is 2.08.
Mean and standard deviation for
Use Ti 83 calculator to find the mean and standard deviation as follows:
- Select STAT > Edit > Enter the values of
- Click
- Click
- Click Enter.
- Click
- Click
- Click Enter.
Output using Ti 83 calculator is given below:
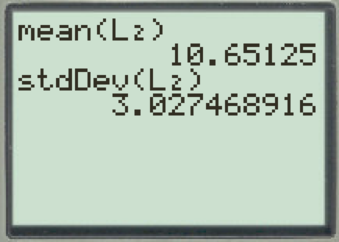
From the Ti 83 calculator output, the mean value is 10.65, and standard deviation value is 3.03.
Hence, the sample mean and the sample standard deviation by using the calculator is verified.
(b)
Find the 95% confidence interval for
(b)
Answer to Problem 13CRP
The 95% confidence interval for
Explanation of Solution
Confidence interval:
The confidence interval for
In the formula,
The confidence level is 95%.
Critical value:
Substitute 72 for
The degrees of freedom are 71.
Use the Appendix II: Tables, Table 6: Critical Values for Student’s t Distribution:
- In d.f. column locate the value 71 which is not available in the table consider as 70.
- In c row of locate the value 0.95.
- The intersecting value of row and columns is 1.994.
The critical value is 1.994.
Substitute 72 for
The margin of error E is 0.83.
Substitute 11.42 for
Hence, the 95% confidence interval for
(c)
Interpret the confidence interval in the context of the problem.
Identify whether the interval consist of numbers that are all positive or all negative or of different signs.
Explain whether mean soil water content of the first field higher than that of the second field, at 95% level of confidence.
(c)
Explanation of Solution
From part (b), the 95% confidence interval for difference between means is
The confidence interval can be interpreted as; there is 95% confidence that the difference in population mean of soil water content lies within the interval –0.06 to 1.60.
It can be observed that, the 95% confidence interval calculated for difference of means
The 95% confidence interval calculated for difference of means
Since there is no difference between the two population means, at 95% confidence level it cannot be determined whether soil water content of the first field higher than that of the second field.
(d)
Identify and explain the distribution that is used for calculating interval.
Explain whether any additional information about the soil water content distributions is required or not.
(d)
Answer to Problem 13CRP
The distribution that is used for calculating interval is Student’s t distribution. Since the
Explanation of Solution
In the study, the population standard deviation of soil water content from field I
Hence, the distribution that is used for calculating interval is Student’s t distribution.
The size of first sample is
Want to see more full solutions like this?
Chapter 7 Solutions
Bundle: Understandable Statistics: Concepts And Methods, 12th + Jmp Printed Access Card For Peck's Statistics + Webassign Printed Access Card For ... And Methods, 12th Edition, Single-term


- for a population with μ = 60 and σ = 8, the X value corresponding to z = 1.50 would be........................................arrow_forwardThe table below shows the number of state-registered automatic weapons and the murder rate for several Northwestern states. xx 11.9 8.6 6.9 3.5 2.6 2.8 2.4 0.3 yy 13.9 11.2 9.6 7.1 6.1 6.2 6 4.5 xx = thousands of automatic weaponsyy = murders per 100,000 residentsThis data can be modeled by the equation y=0.82x+4.07.y=0.82x+4.07. Use this equation to answer the following;Special Note: I suggest you verify this equation by performing linear regression on your calculator.A) How many murders per 100,000 residents can be expected in a state with 8.8 thousand automatic weapons?Answer = ? Round to 4 decimal places.B) How many murders per 100,000 residents can be expected in a state with 5.4 thousand automatic weapons?Answer =? Round to 4 decimal places.arrow_forwardmy question is: If one earthquake has a magnitude of 5 on the Richter scale and a second earthquake has a magnitude of 6, what is the relationship between the intensities of the two earthquakes?arrow_forward
- Question 2Identify the following variables as qualitative or quantitative. (c) the fast-food establishment preferred by customers such as McDonalds orBurger King.(d) the mercury concentration in a sample of tuna.arrow_forwardFor a population with u=50 and o=10,what is the x value corresponding to z=0.4?arrow_forwardIn general, ___________% of the values in a data set lie at or below the 28 th percentile. _______________ % of the values in a data set lie at or above the 90 th percentile.. If a sample consists of 700 test scores, _________of them would be at or below the 52 th percentile. If a sample consists of 700 test scores, ________ of them would be at or above the 64 th percentile.arrow_forward
- The table below shows the number of state-registered automatic weapons and the murder rate for several Northwestern states. xx 11.6 8 6.8 3.6 2.4 2.3 2.3 0.3 yy 14.1 10.9 9.7 7.2 6.1 6.2 5.7 4.3 xx = thousands of automatic weaponsyy = murders per 100,000 residentsThis data can be modeled by the equation ˆy=0.86x+4.y^=0.86x+4. Use this equation to answer the following.A) How many murders per 100,000 residents can be expected in a state with 1.7 thousand automatic weapons?Answer = Round to 3 decimal places.B) How many murders per 100,000 residents can be expected in a state with 6.9 thousand automatic weapons?Answer = Round to 3 decimal places.arrow_forwardThe table below shows the number of state-registered automatic weapons and the murder rate for several Northwestern states. xx 11.3 8.6 7.1 3.3 2.4 2.3 2.4 0.7 yy 13.7 11.1 10.4 6.9 6.4 6.2 6.1 4.9 xx = thousands of automatic weaponsyy = murders per 100,000 residentsThis data can be modeled by the equation y=0.83x+4.28.y=0.83x+4.28. Use this equation to answer the following;Special Note: I suggest you verify this equation by performing linear regression on your calculator.A) How many murders per 100,000 residents can be expected in a state with 10.7 thousand automatic weapons?Answer = Round to 3 decimal places.B) How many murders per 100,000 residents can be expected in a state with 1.6 thousand automatic weapons?Answer = Round to 3 decimal places.The table below shows the number of state-registered automatic weapons and the murder rate for several Northwestern states. xx 11.3 8.6 7.1 3.3 2.4 2.3 2.4 0.7 yy 13.7 11.1 10.4 6.9 6.4 6.2 6.1 4.9 xx = thousands of…arrow_forwardReferring to Table 1, the critical value(s) is (are) ________. Question 3 options: 1) 56 2) 0.000859 3) 6.37169 4) 2.76943arrow_forward
- For each of the following variables, indicate whether it is qualitative or quantitative. For quantitative variables, further categorize them into either discrete or continuous type.e. Heightf. Blood typeg. Per capita incomeh. Household sizei. Mid-upper arm circumference (in cm)arrow_forward1.) 1. Compute for the Age specific Death rate for All ages: (based on the picture) A. 39.4B. 15C. 38D. 40arrow_forwardThe table below shows the number of state-registered automatic weapons and the murder rate for several Northwestern states. xx 11.6 8 7.1 3.7 2.7 2.6 2.1 0.9 yy 14 10.9 9.8 7.2 6 6.3 6.1 4.5 xx = thousands of automatic weaponsyy = murders per 100,000 residentsThis data can be modeled by the equation y=0.86x+3.92.y=0.86x+3.92. Use this equation to answer the following;A) How many murders per 100,000 residents can be expected in a state with 5.9 thousand automatic weapons?Answer = Round to 3 decimal places.B) How many murders per 100,000 residents can be expected in a state with 2.7 thousand automatic weapons?Answer = Round to 3 decimal places. Submit QuestionQuestion 18arrow_forward
 MATLAB: An Introduction with ApplicationsStatisticsISBN:9781119256830Author:Amos GilatPublisher:John Wiley & Sons Inc
 Probability and Statistics for Engineering and th...StatisticsISBN:9781305251809Author:Jay L. DevorePublisher:Cengage Learning
 Statistics for The Behavioral Sciences (MindTap C...StatisticsISBN:9781305504912Author:Frederick J Gravetter, Larry B. WallnauPublisher:Cengage Learning
 Elementary Statistics: Picturing the World (7th E...StatisticsISBN:9780134683416Author:Ron Larson, Betsy FarberPublisher:PEARSON
 The Basic Practice of StatisticsStatisticsISBN:9781319042578Author:David S. Moore, William I. Notz, Michael A. FlignerPublisher:W. H. Freeman
 Introduction to the Practice of StatisticsStatisticsISBN:9781319013387Author:David S. Moore, George P. McCabe, Bruce A. CraigPublisher:W. H. Freeman