
Concept explainers
Videos
The following pictograph shows the six occupations with the largest estimated numerical increase in employment in the United States between 2016 and 2026. Use this graph to answer Exercises 1 through 4.
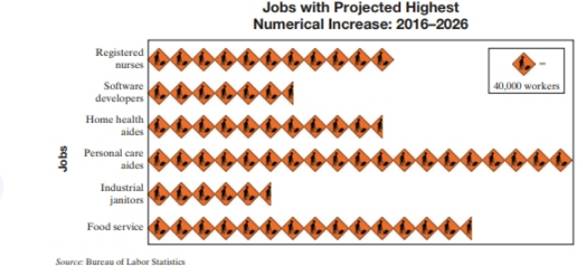
- Approximate the increase in the number of softwar develpers from 2016 to 2026.
The approximate increase in the number of software developers from 2016 to 2026
Answer to Problem 1IR
Explanation of Solution
Given information:
Pictograph showing the six occupations with the largest estimated numerical increase in employment in the United States between 2016 and 2026

Concept Used:
Pictograph is a graph in which pictures are used they contains a key that explains the meaning of the symbol used. It’s advantage is that comparisons can easily be made.
Calculation:
In order determine the approximate increase in the number of software developers from 2016 to 2026, we have to read the given pictograph and find the number of symbols software developers correspond to.
As, the given pictograph shows that the software developers corresponds to
Thus, the approximate increase in the number of software developers from 2016 to 2026 is
Thus, there is increment of approximate
Want to see more full solutions like this?
Chapter 7 Solutions
Algebra Foundations


 Algebra: Structure And Method, Book 1AlgebraISBN:9780395977224Author:Richard G. Brown, Mary P. Dolciani, Robert H. Sorgenfrey, William L. ColePublisher:McDougal Littell