Concept explainers
Videos
Expected return and standard deviation A game of chance offers the following odds and payoffs. Each play of the game costs $100, so the net profit per play is the payoff less $100.
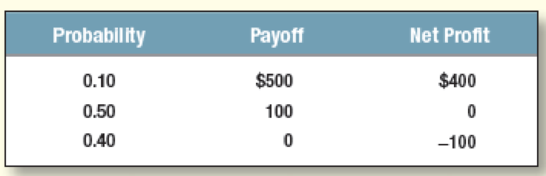
What are the expected cash payoff and expected
To compute: The expected payoff and expected rate of return.
Explanation of Solution
The formula to calculate expected payoff is as follows:
The computation of expected payoff is as follows:
Hence, the expected payoff is $100
The formula to calculate rate of return is as follows:
The calculation of rate of return is as follows:
The formula to calculate expected rate of return is as follows:
The calculation of expected rate of return is as follows:
Hence, the expected rate of return is 0%.
To compute: The variance and standard deviation of rate of return.
Explanation of Solution
The formula to calculate variance is as follows:
The computation of variance is as follows:
Hence, the variance is 20,000.
The formula to compute standard deviation is as follows:
The computation of standard deviation is as follows:
Hence, the standard deviation is 141.42%.
Want to see more full solutions like this?
Chapter 7 Solutions
International Edition---principles Of Corporate Finance, 12th Edition


- What are the (a) expected return, (b) standard deviation, and (c) coefficient of variation for an investment with the following probability distribution? Probability Payoff 0.2 19.0% 0.7 9.0 0.1 4.0arrow_forwardAn investment has probabilities 0.15, 0.34, 0.44, 0.67, 0.2 and 0.15 of giving returns equal to 50%, 39%, -4%, 20%, -25%, and 42%. What are the expected returns and the standard deviations of returns?arrow_forwardMean and Variance of Discrete Random Variable and the Characteristics of Normal Random Variable Example 1: Suppose that you are given the option of two investment portfolios, A and B, with potential profits and the associated probabilities displayed below. PORTFOLIO A Profit X -2,000 -4,000 3,000 5,000 PROBABILITY P(x) 0.3 0.1 0.3 0.3 PORTFOLIO B Profit X -3,000 -2,000 4,000 5,000 Probability P(X) 0.2 0.2 0.4 0.2 Calculated Mean and Standard Deviation for Portrollo A: Mean = 1,400 and standard deviation = 3,322.65 Calculated Mean and Standard Deviation for Portrollo B: Mean=1,600 and standard deviation= 3,882.31 A. using the mean and variance of portfolio A, interpret the result B.Based on the expected profits, which portfolio will you choose?arrow_forward
- Consider 2 scenarios: Boom Economy and Normal Economy. The Boom economy has 20% chance of happening, while Normal economy has 80% chance of happening. For each scenario (Boom and Normal), stock ABC has a return of 25%, and 4%, respectively; stock XYZ has a return of 10% and 6.5%, respectively; the market portfolio has a return of 12% and 5% respectively. 1) Calculate Expected return, Variance and Standard deviation for stock ABC and XYZ 2) Based on your results in part (1), can you decide which stock to invest?3) Calculate Beta for stock ABC and XYZ 4) If the T-bill rate is 3%, what does the CAPM say about the fair expected rate of return on the two stocks? How does this result influence your investment decision?arrow_forwardConsider 2 scenarios: Boom Economy and Normal Economy. The Boom economy has 30% chance of happening, while Normal economy has 70% chance of happening. For each scenario (Boom and Normal), stock ABC has a return of 25%, and 4%, respectively; stock XYZ has a return of 10% and 6.5%, respectively; the market portfolio has a return of 12% and 5% respectively. 1) Calculate Expected return, Variance and Standard deviation for stock ABC and XYZ 2) Based on your results in part (1), can you decide which stock to invest? 3) Calculate Beta for stock ABC and XYZ 4) If the T-bill rate is 3%, what does the CAPM say about the fair expected rate of return on the two stocks? How does this result influence your investment decision?arrow_forwardThe cash position of a merchant is 10000 bushels of wheat , the variance of the changes of forward price is 0.00094, the variance of the changes of the base is 0.000453, the variance of the cash price changes is 0.000805 and the covariance of the changes of forward price with the changes of the cash prices is 0.000518. Calculate the efficiency of the hedge and choose one of the following answers. a. 0.97 b. 0.31 c. 0.69 d. 0.03arrow_forward
- The market and Stock J have the following probability distributions: Probability rM rJ 0.3 15% 20% 0.4 9 5 0.3 18 12 Calculate the expected rates of return for the market and Stock J. Calculate the standard deviations for the market and Stock J. Calculate the coefficients of variation for the market and Stock J.arrow_forwardWhat is the required return on an investment with a beta of 1.3 if the riskfreerate is 2.0 percent and the return on the market is 8.1 percent? If the expected return on the investment is 11.2 percent, what should you do?arrow_forwardSecurity A has an expected return of 7%, a standard deviation of returns of 35%, a correlation coefficient with the market of −0.3, and a beta coefficient of −1.5. Security B has an expected return of 12%, a standard deviation of returns of 10%, a correlation with the market of 0.7, and a beta coefficient of 1.0. Which security is riskier? Why?arrow_forward
- Consider a decision maker who is comfortable with an investment decision that has a 50% chance of earning $25,000 and a 50% chance of losing $12,500, but not with any larger investments that have the same relative payoffs. Write the equation for the exponential function that approximates this decision maker’s utility function. Plot the exponential utility function for this decision maker for x values between –20,000 and 35,000. Is this decision maker risk-seeking, risk-neutral, or risk-averse? Suppose the decision maker decides that she would actually be willing to make an investment that has a 50% chance of earning $30,000 and a 50% chance of losing $15,000. Plot the exponential function that approximates this utility function and compare it to the utility function from part (b). Is the decision maker becoming more risk-seeking or more risk-averse?arrow_forwardA firm has three investment alternatives. Payoffs are in thousands of dollars. a. Using the expected value approach, which decision is preferred? b. For the lottery having a payoff of 100,000 with probability p and 0 with probability (1 p), two decision makers expressed the following indifference probabilities. Find the most preferred decision for each decision maker using the expected utility approach. c. Why dont decision makers A and B select the same decision alternative?arrow_forwardThree decision makers have assessed utilities for the following decision problem (payoff in dollars): The indifference probabilities are as follows: Plot the utility function for money for each decision maker. Classify each decision maker as a risk avoider, a risk taker, or risk-neutral. For the payoff of 20, what is the premium that the risk avoider will pay to avoid risk? What is the premium that the risk taker will pay to have the opportunity of the high payoff?arrow_forward
 Intermediate Financial Management (MindTap Course...FinanceISBN:9781337395083Author:Eugene F. Brigham, Phillip R. DavesPublisher:Cengage Learning
 Essentials of Business Analytics (MindTap Course ...StatisticsISBN:9781305627734Author:Jeffrey D. Camm, James J. Cochran, Michael J. Fry, Jeffrey W. Ohlmann, David R. AndersonPublisher:Cengage Learning