
Statistical Reasoning for Everyday Life - MyStatLab
5th Edition
ISBN: 9781323823781
Author: Bennett
Publisher: PEARSON
expand_more
expand_more
format_list_bulleted
Videos
Textbook Question
Chapter 7, Problem 5CRE
Pizza and the Subway. For Exercises 1–6, refer to the following table that lists the cost (in dollars) of a slice of pizza in New York City and the subway fare in the same year.
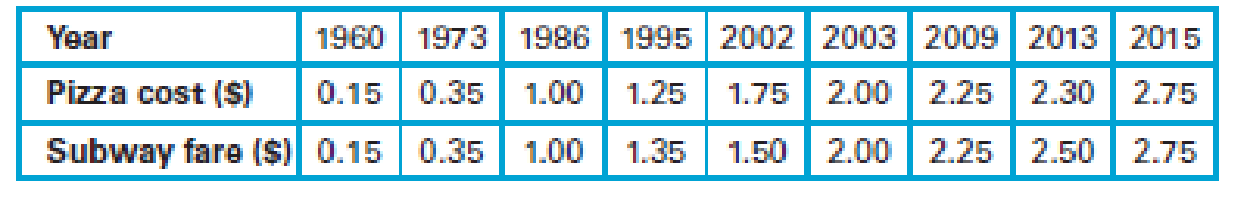
5. Does it appear that the best-fit line can be used to make a reasonably good prediction of subway fare given the cost of a slice of pizza?
Expert Solution & Answer
Want to see the full answer?
Check out a sample textbook solution
Students have asked these similar questions
Large companies typically collect volumes of data before designing a product, not only to gain information as to whether the product should be released, but also to pinpoint which markets would be the best targets for the product. Several months ago, I was interviewed by such a company while shopping at a mall. I was asked about my exercise habits and whether or not I'd be interested in buying a video/DVD designed to teach stretching exercises. I fall into the male, 18-35-years-old category, and I guessed that, like me, many males in that category would not be interested in a stretching video. My friend Holly falls in the female, older-than-35 category, and I was thinking that she might like the stretching video. After being interviewed, I looked at the interviewer's results. Of the
89
people in my market category who had been interviewed,
20
said they would buy the product, and of the
103
people in Holly's market category,
28
said they would buy it. Assuming that these…
Large companies typically collect volumes of data before designing a product, not only to gain information as to whether the product should be released, but also to pinpoint which markets would be the best targets for the product. Several months ago, I was interviewed by such a company while shopping at a mall. I was asked about my exercise habits and whether or not I'd be interested in buying a video/DVD designed to teach stretching exercises. I fall into the male, 18 – 35-years-old category, and I guessed that, like me, many males in that category would not be interested in a stretching video. My friend Diane falls in the female, older-than-35 category, and I was thinking that she might like the stretching video. After being interviewed, I looked at the interviewer's results. Of the 93 people in my market category who had been interviewed, 17 said they would buy the product, and of the 113 people in Diane's market category, 34 said they would buy it. Assuming that these data came…
Large companies typically collect volumes of data before designing a product, not only to gain information as to whether the product should be released, but also to pinpoint which markets would be the best targets for the product. Several months ago, I was interviewed by such a company while shopping at a mall. I was asked about my exercise habits and whether or not I'd be interested in buying a video/DVD designed to teach stretching exercises. I fall into the male, 18 – 35-years-old category, and I guessed that, like me, many males in that category would not be interested in a stretching video. My friend Amanda falls in the female, older-than-35 category, and I was thinking that she might like the stretching video. After being interviewed, I looked at the interviewer's results. Of the 97 people in my market category who had been interviewed, 16 said they would buy the product, and of the 101 people in Amanda's market category, 31 said they would buy it. Assuming that these data came…
Chapter 7 Solutions
Statistical Reasoning for Everyday Life - MyStatLab
Ch. 7.1 - Correlation. What is a correlation? Give three...Ch. 7.1 - Scatterplot. What is a scatterplot, and how is one...Ch. 7.1 - Types of Correlation. Define and distinguish...Ch. 7.1 - Correlation Coefficient. What does the correlation...Ch. 7.1 - Does It Make Sense? For Exercises 58, determine...Ch. 7.1 - Does It Make Sense? For Exercises 58, determine...Ch. 7.1 - Does It Make Sense? For Exercises 58, determine...Ch. 7.1 - Does It Make Sense? For Exercises 58, determine...Ch. 7.1 - Correlation. Exercises 916 list pairs of...Ch. 7.1 - Correlation. Exercises 916 list pairs of...
Ch. 7.1 - Correlation. Exercises 916 list pairs of...Ch. 7.1 - Correlation. Exercises 916 list pairs of...Ch. 7.1 - Correlation. Exercises 916 list pairs of...Ch. 7.1 - Correlation. Exercises 916 list pairs of...Ch. 7.1 - Correlation. Exercises 916 list pairs of...Ch. 7.1 - Correlation. Exercises 916 list pairs of...Ch. 7.1 - Crickets and Temperature. One classic example of a...Ch. 7.1 - Two-Day Forecast. Figure 7.8 shows a scatterplot...Ch. 7.1 - Properties of the Correlation Coefficient. For...Ch. 7.1 - Properties of the Correlation Coefficient. For...Ch. 7.1 - Properties of the Correlation Coefficient. For...Ch. 7.1 - Properties of the Correlation Coefficient. For...Ch. 7.1 - Scatterplot and Correlation. In Exercises 2330,...Ch. 7.1 - Scatterplot and Correlation. In Exercises 2330,...Ch. 7.1 - Scatterplot and Correlation. In Exercises 2330,...Ch. 7.1 - Prob. 26ECh. 7.1 - Scatterplot and Correlation. In Exercises 2330,...Ch. 7.1 - Scatterplot and Correlation. In Exercises 2330,...Ch. 7.1 - Scatterplot and Correlation. In Exercises 2330,...Ch. 7.1 - Scatterplot and Correlation. In Exercises 2330,...Ch. 7.1 - Your Own Positive Correlations. Give examples of...Ch. 7.1 - Your Own Negative Correlations. Give examples of...Ch. 7.2 - Outliers. Briefly explain how an outlier can make...Ch. 7.2 - Grouped Data. Briefly explain how data that...Ch. 7.2 - Explanations for Correlation. What are the three...Ch. 7.2 - Prob. 4ECh. 7.2 - Does It Make Sense? For Exercises 58, determine...Ch. 7.2 - Does It Make Sense? For Exercises 58, determine...Ch. 7.2 - Does It Make Sense? For Exercises 58, determine...Ch. 7.2 - Does It Make Sense? For Exercises 58, determine...Ch. 7.2 - Correlation and Causality. Exercises 916 present...Ch. 7.2 - Correlation and Causality. Exercises 916 present...Ch. 7.2 - Correlation and Causality. Exercises 916 present...Ch. 7.2 - Correlation and Causality. Exercises 916 present...Ch. 7.2 - Correlation and Causality. Exercises 916 present...Ch. 7.2 - Correlation and Causality. Exercises 916 present...Ch. 7.2 - Correlation and Causality. Exercises 916 present...Ch. 7.2 - Correlation and Causality. Exercises 916 present...Ch. 7.2 - Outlier Effects. Consider the scatterplot in...Ch. 7.2 - Outlier Effects. Consider the scatterplot in...Ch. 7.2 - Footprint and Height. The following table lists...Ch. 7.2 - January and July High Temperatures. The following...Ch. 7.2 - Birth and Death Rates. Figure 7.17 shows the birth...Ch. 7.2 - Penny Weight and Date. The scatterplot in Figure...Ch. 7.3 - Best-Fit Line. What is a best-fit line? How is a...Ch. 7.3 - Prob. 2ECh. 7.3 - Interpreting r2. What does the square of the...Ch. 7.3 - Prob. 4ECh. 7.3 - Prob. 5ECh. 7.3 - Does It Make Sense? For Exercises 58, determine...Ch. 7.3 - Does It Make Sense? For Exercises 58, determine...Ch. 7.3 - Does It Make Sense? For Exercises 58, determine...Ch. 7.3 - Best-Fit Lines. Exercises 916 refer to tables in...Ch. 7.3 - Best-Fit Lines. Exercises 916 refer to tables in...Ch. 7.3 - Prob. 11ECh. 7.3 - Best-Fit Lines. Exercises 916 refer to tables in...Ch. 7.3 - Best-Fit Lines. Exercises 916 refer to tables in...Ch. 7.3 - Best-Fit Lines. Exercises 916 refer to tables in...Ch. 7.3 - Prob. 15ECh. 7.3 - Prob. 16ECh. 7.4 - Correlation and Causality. What is the difference...Ch. 7.4 - Prob. 2ECh. 7.4 - Establishing Causality. Briefly state in your own...Ch. 7.4 - Confidence in Causality. Describe three levels of...Ch. 7.4 - Prob. 5ECh. 7.4 - Does It Make Sense? For Exercises 58, determine...Ch. 7.4 - Does It Make Sense? For Exercises 58, determine...Ch. 7.4 - Does It Make Sense? For Exercises 58, determine...Ch. 7.4 - Physical Models. For Exercises 912, determine...Ch. 7.4 - Physical Models. For Exercises 912, determine...Ch. 7.4 - Physical Models. For Exercises 912, determine...Ch. 7.4 - Physical Models. For Exercises 912, determine...Ch. 7.4 - Altitude and Health. When some people climb to...Ch. 7.4 - Smoking and Lung Cancer. There is a strong...Ch. 7.4 - Other Lung Cancer Causes. Several things besides...Ch. 7.4 - Longevity of Orchestra Conductors. A famous study...Ch. 7.4 - Older Moms. A study reported in Nature claims that...Ch. 7.4 - High-Voltage Power Lines. Suppose that people...Ch. 7.4 - Gun Control. Those who favor gun control often...Ch. 7.4 - Vasectomies and Prostate Cancer. The article Does...Ch. 7 - Pizza and the Subway. For Exercises 16, refer to...Ch. 7 - Pizza and the Subway. For Exercises 16, refer to...Ch. 7 - Pizza and the Subway. For Exercises 16, refer to...Ch. 7 - Pizza and the Subway. For Exercises 16, refer to...Ch. 7 - Pizza and the Subway. For Exercises 16, refer to...Ch. 7 - Pizza and the Subway. For Exercises 16, refer to...Ch. 7 - For 10 pairs of sample data values, the...Ch. 7 - In a study involving randomly selected subjects,...Ch. 7 - A researcher collects paired sample data values...Ch. 7 - Estimate the value of the linear correlation...Ch. 7 - Fill in the blanks: Every possible correlation...Ch. 7 - Which of the following are likely to have a...Ch. 7 - For a collection of 50 pairs of sample data...Ch. 7 - Estimate the correlation coefficient for the data...Ch. 7 - Refer again to the scatterplot in Figure 7.24....Ch. 7 - Fill in the blank: If r = 0.900, then _____ % of...Ch. 7 - In Exercises 710, determine whether the given...Ch. 7 - Prob. 8CQCh. 7 - Prob. 9CQCh. 7 - Prob. 10CQ
Knowledge Booster


Learn more about
Need a deep-dive on the concept behind this application? Look no further. Learn more about this topic, statistics and related others by exploring similar questions and additional content below.Similar questions
- Use the data and develop a model to predict Overall Satisfaction. If a customer reports satisfaction with trade price as 3.3 and satisfaction with the speed of execution as 2.6, we can predict their overall satisfaction to be what? (Keep one decimal place) Brokerage Satisfaction with Trade Price Satisfaction with Speed of Execution Overall Satisfaction with Electronic Trades Scottrade, Inc. 3.4 3.4 3.5 Charles Schwab 3.2 3.3 3.4 Fidelity Brokerage Services 3.1 3.4 3.9 TD Ameritrade 2.9 3.6 3.7 E*Trade Financial 2.9 3.2 2.9 (Not listed) 2.1 3.2 2.7 Vanguard Brokerage Services 2.0 3.8 2.8 USAA Brokerage Services 2.1 3.8 3.6 Thinkorswim 1.9 2.6 2.6 Wells Fargo Investments 2.2 2.7 2.3 Interactive Brokers 3.1 4.0 4.0 Zecco.com 2.5 2.5 2.5 Firstrade Securities 3.0 3.0 4.0 Banc of America Investment Services 4.0 1.0 2.0arrow_forwardBefore students wrote a mathematics examination, their teacher had made predictions about the results that students will receive. After the actual results of the examinations, the results for 150 candidates were classified according to whether the predicted grade was better than, equal to, or worse than the actual grade, as shown in the following table: Predicted grade Actual Grade Obtained Better Equal Worst B 17 30 12 59 C 10 22 9 41 D 20 15 15 50 47 67 36 150 Carry out a χ2 test at the 5% level of significance to determine whether the teachers prediction and the actual results are independentarrow_forwardRecent research published by Frumin and colleagues (2011) in the journal Science addresses whether females' tears have an effect on males. Imagine that exposure to tears lowered self-rated sexual arousal by 1.27 points, with a margin of error of ±0.32 points. The point estimate is: Question 7 options: [0.95, 1.59]. 1.27. 1.27 +/– 0.32. 0.32.arrow_forward
- According to the February 2008 Federal Trade Commission report on consumer fraud and identity theft, 23% of all complaints in 2007 were for identity theft. In that year, Alaska had 321 complaints of identity theft out of 1,432 consumer complaints ("Consumer fraud and," 2008). Does this data provide enough evidence to show that Alaska had a lower proportion of identity theft than 23%? Test at the 5% level. (v) Do values for np and nq both exceed 5? Enter YES or NO for answer (vi) Calculate and enter test statistic Enter value in decimal form rounded to nearest thousandth, with appropriate sign (no spaces). Examples of correctly entered answers: –2.014 –0.370 +0.600 +1.009 (vii) Using tables, calculator, or spreadsheet: Determine and enter p-value corresponding to test statistic. Enter value in decimal form rounded to nearest thousandth. Examples of correctly entered answers: 0.000 0.001 0.030 0.600 0.814 1.000arrow_forwardThe Conch Café, located in Gulf Shores, Alabama, features casual lunches with a great view of the Gulf of Mexico. To accommodate the increase in business during the summer vacation season, Fuzzy Conch, the owner, hires a large number of servers as seasonal help. When he interviews a prospective server, he would like to provide data on the amount a server can earn in tips. He believes that the amount of the bill and the number of diners are both related to the amount of the tip. He gathered the following sample information. Customer Amount of Tip Amount of Bill Number of Diners Customer Amount of Tip Amount of Bill Number of Diners 1 $ 6.05 $ 73.22 1 16 $ 3.30 $ 23.59 2 2 4.50 28.23 4 17 3.50 22.30 2 3 1.00 10.65 1 18 3.25 32.00 2 4 2.40 19.82 3 19 5.40 50.02 4 5 5.00 28.62 3 20 2.25 17.60 3 6 4.25 24.83 2 21 1.40 41.80 5 7 .50 6.25 1 22 3.00 20.27 2…arrow_forwardThe Conch Café, located in Gulf Shores, Alabama, features casual lunches with a great view of the Gulf of Mexico. To accommodate the increase in business during the summer vacation season, Fuzzy Conch, the owner, hires a large number of servers as seasonal help. When he interviews a prospective server, he would like to provide data on the amount a server can earn in tips. He believes that the amount of the bill and the number of diners are both related to the amount of the tip. He gathered the following sample information. Customer Amount of Tip Amount of Bill Number of Diners Customer Amount of Tip Amount of Bill Number of Diners 1 $ 7.00 $ 48.97 5 16 $ 3.30 $ 23.59 2 2 4.50 28.23 4 17 3.50 22.30 2 3 1.00 10.65 1 18 3.25 32.00 2 4 2.40 19.82 3 19 5.40 50.02 4 5 5.00 28.62 3 20 2.25 17.60 3 6 4.25 24.83 2 21 5.50 44.47 4 7 0.50 6.24 1 22 3.00 20.27 2…arrow_forward
arrow_back_ios
arrow_forward_ios
Recommended textbooks for you
 Holt Mcdougal Larson Pre-algebra: Student Edition...AlgebraISBN:9780547587776Author:HOLT MCDOUGALPublisher:HOLT MCDOUGAL
 Big Ideas Math A Bridge To Success Algebra 1: Stu...AlgebraISBN:9781680331141Author:HOUGHTON MIFFLIN HARCOURTPublisher:Houghton Mifflin Harcourt
 Glencoe Algebra 1, Student Edition, 9780079039897...AlgebraISBN:9780079039897Author:CarterPublisher:McGraw Hill
Holt Mcdougal Larson Pre-algebra: Student Edition...
Algebra
ISBN:9780547587776
Author:HOLT MCDOUGAL
Publisher:HOLT MCDOUGAL
Big Ideas Math A Bridge To Success Algebra 1: Stu...
Algebra
ISBN:9781680331141
Author:HOUGHTON MIFFLIN HARCOURT
Publisher:Houghton Mifflin Harcourt
Glencoe Algebra 1, Student Edition, 9780079039897...
Algebra
ISBN:9780079039897
Author:Carter
Publisher:McGraw Hill
What Are Research Ethics?; Author: HighSchoolScience101;https://www.youtube.com/watch?v=nX4c3V23DZI;License: Standard YouTube License, CC-BY
What is Ethics in Research - ethics in research (research ethics); Author: Chee-Onn Leong;https://www.youtube.com/watch?v=W8Vk0sXtMGU;License: Standard YouTube License, CC-BY