
a.
The
a.
Answer to Problem 7.38TY
The scatter plot is shown below,
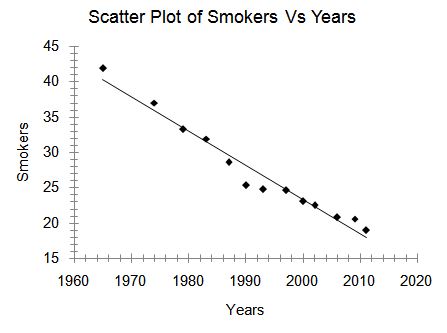
Figure (1)
Explanation of Solution
Given Info:
The percentages of adult smokers in the years between 1965 and 2011 is given below,
| Years | Smokers |
| 1965 | 41.9 |
| 1974 | 37 |
| 1979 | 33.3 |
| 1983 | 31.9 |
| 1987 | 28.6 |
| 1990 | 25.3 |
| 1993 | 24.8 |
| 1997 | 24.6 |
| 2000 | 23.1 |
| 2002 | 22.5 |
| 2006 | 20.8 |
| 2009 | 20.6 |
| 2011 | 19 |
Software Procedure:
Step by step procedure to draw the scatterplot using the Excel:
Steps to draw a scatter plot of the given data are:
- Press [Ctrl]-N for a new workbook.
- Enter the years column A.
- Enter the percent of adult smokers into column B.
- Select Add ins then Megastats.
- Select
Correlation /Regression and under that select scatter plot. - Select the column 1 in horizontal axis and column 2 in vertical axis.
- Tick the plot linear regression line and press Ok.
Output using the Excel is given below:
Observation:
The scatter plot shows that, the number of smokers’ decreases as the year’s increases.
b.
The direction, form, and strength of the relationship between percent of smokers and year. Whether there are any outliers.
b.
Explanation of Solution
From the scatterplot, it is clear that the value of smokers decreases with increase in number of year that means there is a linear relationship between smokers and years and number of smokers decreases with increase in year so, relationship is negative.
Thus, there is a strong negative linear relationship between the smokers and the year and there are no outliers.
c.
The least squares regression line that predicts percent of smokers from year and add the line to the scatter plot.
c.
Answer to Problem 7.38TY
The equation of the least square regression line is
Explanation of Solution
Given info:
The given values are,
Calculation:
The formula for regression equation is given below,
Where,
The formula to calculate the value of b is,
Substitute
The value of b is
The formula to calculate the value of a is,
Substitute
The value of a is
Substitute
Thus, the equation of the least square regression line is
d.
The decline in smoking per year on an average during this period.
d.
Answer to Problem 7.38TY
The decline in smoking per year on an average during this period is
Explanation of Solution
Calculation:
The equation of the least square regression line is,
The slope of the regression is
The coefficient value for year is
Thus, the decline in smoking per year on an average during this period is
e.
The percentage of the variation of adults who smoke can be explained by linear change over time.
e.
Answer to Problem 7.38TY
The percentage of the variation of adults who smoke can be explained by linear change over time is 96.04%.
Explanation of Solution
Calculation:
The formula to find percentage of the variation of adults who smoke can be explained by linear change over time is given by squared value of r.
Thus, the percentage of the variation of adults who smoke can be explained by linear change over time is 96.04%.
f.
The percentage of smokers in 2020.
f.
Answer to Problem 7.38TY
The predicted percentage of adults that smoke in 2020 is 13.48%.
Explanation of Solution
Calculation:
From part (c) the equation for linear regression is given by,
Where,
- x represents the year.
-
Substitute 2020 for x in the above equation to find the percentage of smokers in 2020.
Thus, the predicted percentage of adults that smoke in 2020 is 13.48%.
g.
The percentage of smokers in 2075. And reason that it is foolishness to use this regression line equation to find the percentage of smokers in 2075.
g.
Answer to Problem 7.38TY
The predicted percentage of adults that smoke in 2075 is 13.48%.
Explanation of Solution
Calculation:
From part (c) the equation for linear regression is given by,
Where,
- x represents the year.
-
Substitute 2075 for x in the above equation to find the percentage of smokers in 2075.
Thus, the predicted percentage of adults that smoke in 2020 is
Clearly, the percentage of smokers came out to be negative in 2075 which is impossible.
Thus, it is foolishness to use this regression line equation to find the percentage of smokers in 2075.
Want to see more full solutions like this?
Chapter 7 Solutions
Bundle: Basic Practice of Statistics 7e & LaunchPad (Twelve Month Access)

 MATLAB: An Introduction with ApplicationsStatisticsISBN:9781119256830Author:Amos GilatPublisher:John Wiley & Sons Inc
 Probability and Statistics for Engineering and th...StatisticsISBN:9781305251809Author:Jay L. DevorePublisher:Cengage Learning
 Statistics for The Behavioral Sciences (MindTap C...StatisticsISBN:9781305504912Author:Frederick J Gravetter, Larry B. WallnauPublisher:Cengage Learning
 Elementary Statistics: Picturing the World (7th E...StatisticsISBN:9780134683416Author:Ron Larson, Betsy FarberPublisher:PEARSON
 The Basic Practice of StatisticsStatisticsISBN:9781319042578Author:David S. Moore, William I. Notz, Michael A. FlignerPublisher:W. H. Freeman
 Introduction to the Practice of StatisticsStatisticsISBN:9781319013387Author:David S. Moore, George P. McCabe, Bruce A. CraigPublisher:W. H. Freeman