a.
To make: The stem plot for IQ test scores of 31-seventh grade girls.
To check: Whether there are major departures from normality or not.
a.
Answer to Problem 7.59SE
The stem plot is,
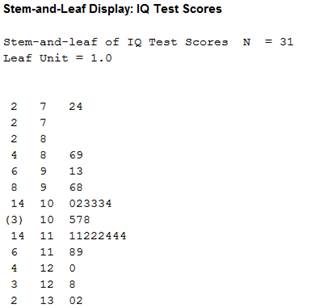
No, there are no major departures from normality.
Explanation of Solution
Given info:
The data shows the IQ test scores of 31 seventh-grade girls in a Midwest school district.
Calculation:
Stemplot:
Software procedure:
Step-by-step software procedure to draw stemplot using MINITAB software is as follows:
- Select Graph > Stem and leaf.
- Select the column of IQ Test Scores in Graph variables.
- Select OK.
The
A observation is a suspected outlier, if it is more than
The difference between the first
That is,
Software procedure:
Step-by-step software procedure for the first quartile and third quartile in MINITAB software is as follows:
- Choose Stat > Basic Statistics > Display
Descriptive Statistics . - In Variables enter the columns IQ Test Scores.
- Choose option statistics, and select first quartile, third quartile.
- Click OK.
Output using MINITAB software is as follows:
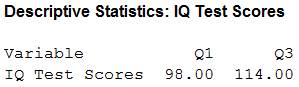
From Minitab output, the first quartile is 98.00 and third quartile is 114.00.
Substitute 114.00 for
The interquartile range is,
Substitute IQR in the
The
Justification:
The stemplot showing that there are two low IQ’s. They are 72 and 74but for the small data, the IQ test scores of 31 seventh-grade girls is approximately normal.
b.
To obtain: The mean
To check: Whether the proportions show an exactly
b.
Answer to Problem 7.59SE
The mean
The proportions of the scores are within 1 standard deviation of the mean, which is 0.742.
The proportions of the scores are within 2 standard deviation of the mean, which is 0.935.
If the distribution is exactly normal, then its proportion should be about 68% of the observations fall within
Explanation of Solution
If the proportions be in an exactly normal distribution then it is,
About 68% of the observations fall within
About 95% of the observations fall within
About 99.7% of the observations fall within
Calculation:
For Mean and Standard deviation:
Software procedure:
Step-by-step software procedure for mean and standard deviation in MINITAB software is as follows:
- Choose Stat > Basic Statistics > Display Descriptive Statistics.
- In Variables enter the columns IQ Test Scores.
- Choose option statistics, and select mean, standard deviation.
- Click OK.
Output using MINITAB software is as follows:
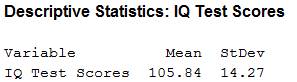
From Minitab output, the mean is 105.84 and standard deviation is 14.27.
The scores are within1 standard deviation and within 2 standard deviations of the mean that are obtained by finding
Substitute 105.84 for x and 14.27 for s,
For proportion of scores within 1 standard deviation:
The IQ test scores in between
The formula to find the proportion of scores within 1 standard deviation is,
Substitute 23 for ‘Number of IQ test scores in between
Thus, the proportion of scores within 1 standard deviation is 0.742.
For proportion of scores within 2 standard deviations:
The IQ test scores in between
The formula to find the proportion of scores within 2 standard deviations is,
Substitute 29 for ‘Number of IQ test scores in between
Thus, the proportion of scores within 2 standard deviations is 0.935.
Justification:
If the distribution is exactly normal, then it should satisfy about 68% of the observations fall within
Here, the proportion of scores within 1 standard deviation is 74.2% and the proportion of scores within 2 standard deviations is 93.5%. Thus, the proportions of scores are reasonably close to the proportion of exactly normal distribution.
Want to see more full solutions like this?
Chapter 7 Solutions
The Basic Practice of Statistics

 MATLAB: An Introduction with ApplicationsStatisticsISBN:9781119256830Author:Amos GilatPublisher:John Wiley & Sons Inc
 Probability and Statistics for Engineering and th...StatisticsISBN:9781305251809Author:Jay L. DevorePublisher:Cengage Learning
 Statistics for The Behavioral Sciences (MindTap C...StatisticsISBN:9781305504912Author:Frederick J Gravetter, Larry B. WallnauPublisher:Cengage Learning
 Elementary Statistics: Picturing the World (7th E...StatisticsISBN:9780134683416Author:Ron Larson, Betsy FarberPublisher:PEARSON
 The Basic Practice of StatisticsStatisticsISBN:9781319042578Author:David S. Moore, William I. Notz, Michael A. FlignerPublisher:W. H. Freeman
 Introduction to the Practice of StatisticsStatisticsISBN:9781319013387Author:David S. Moore, George P. McCabe, Bruce A. CraigPublisher:W. H. Freeman