
Videos
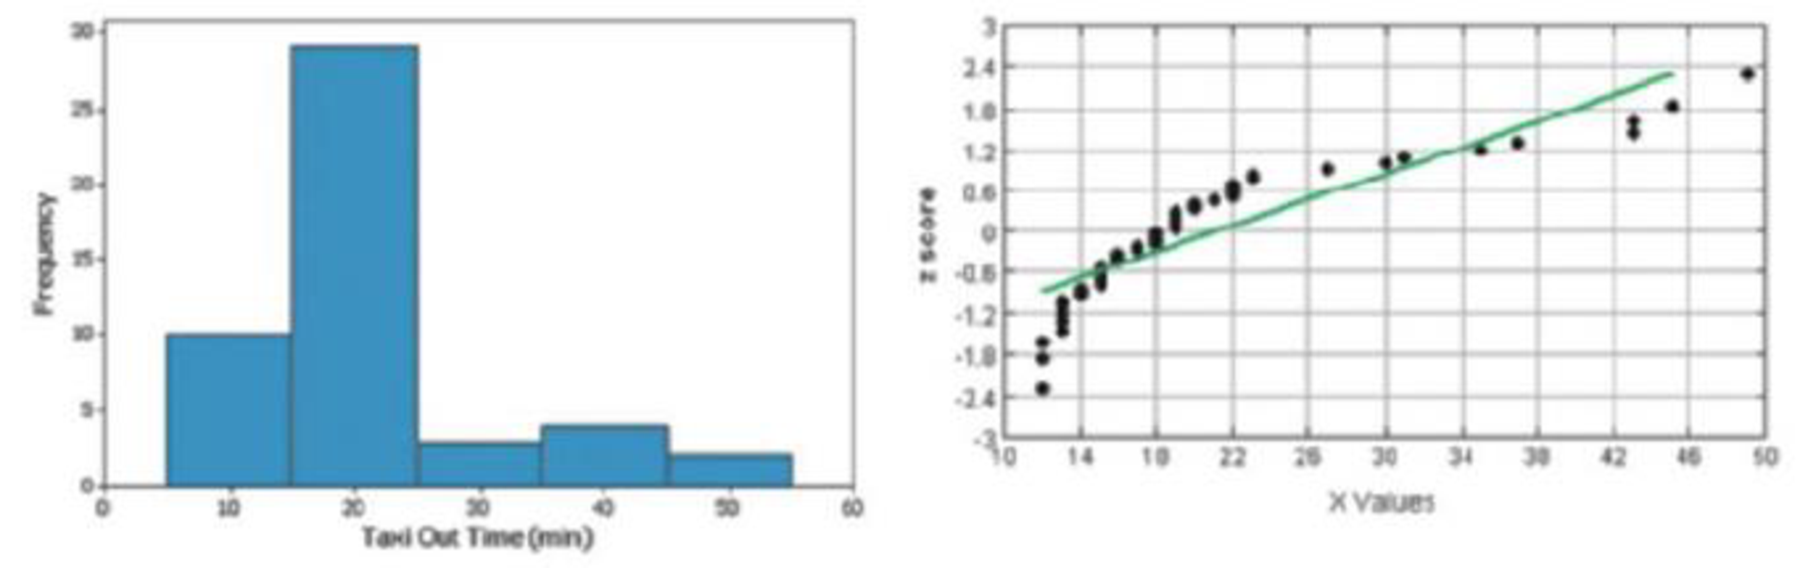
Normality Assessment A random sample consists of 48 times (min) required for American Airlines flights to taxi out for takeoff. All of the flights are American Airlines flights from New York (JFK) to Los Angeles and they all occurred in January of a recent year. The 48 taxi-out times are depicted in the histogram and normal quantile plot shown below. Based on those graphs, does it appear that the taxi-out times are from a population having a
Want to see the full answer?
Check out a sample textbook solution
Chapter 7 Solutions
Elementary Statistics, Books A La Carte Edition Plus MyLab Statistics with Pearson eText - Access Card Package (13th Edition)


 MATLAB: An Introduction with ApplicationsStatisticsISBN:9781119256830Author:Amos GilatPublisher:John Wiley & Sons Inc
 Probability and Statistics for Engineering and th...StatisticsISBN:9781305251809Author:Jay L. DevorePublisher:Cengage Learning
 Statistics for The Behavioral Sciences (MindTap C...StatisticsISBN:9781305504912Author:Frederick J Gravetter, Larry B. WallnauPublisher:Cengage Learning
 Elementary Statistics: Picturing the World (7th E...StatisticsISBN:9780134683416Author:Ron Larson, Betsy FarberPublisher:PEARSON
 The Basic Practice of StatisticsStatisticsISBN:9781319042578Author:David S. Moore, William I. Notz, Michael A. FlignerPublisher:W. H. Freeman
 Introduction to the Practice of StatisticsStatisticsISBN:9781319013387Author:David S. Moore, George P. McCabe, Bruce A. CraigPublisher:W. H. Freeman