
Videos
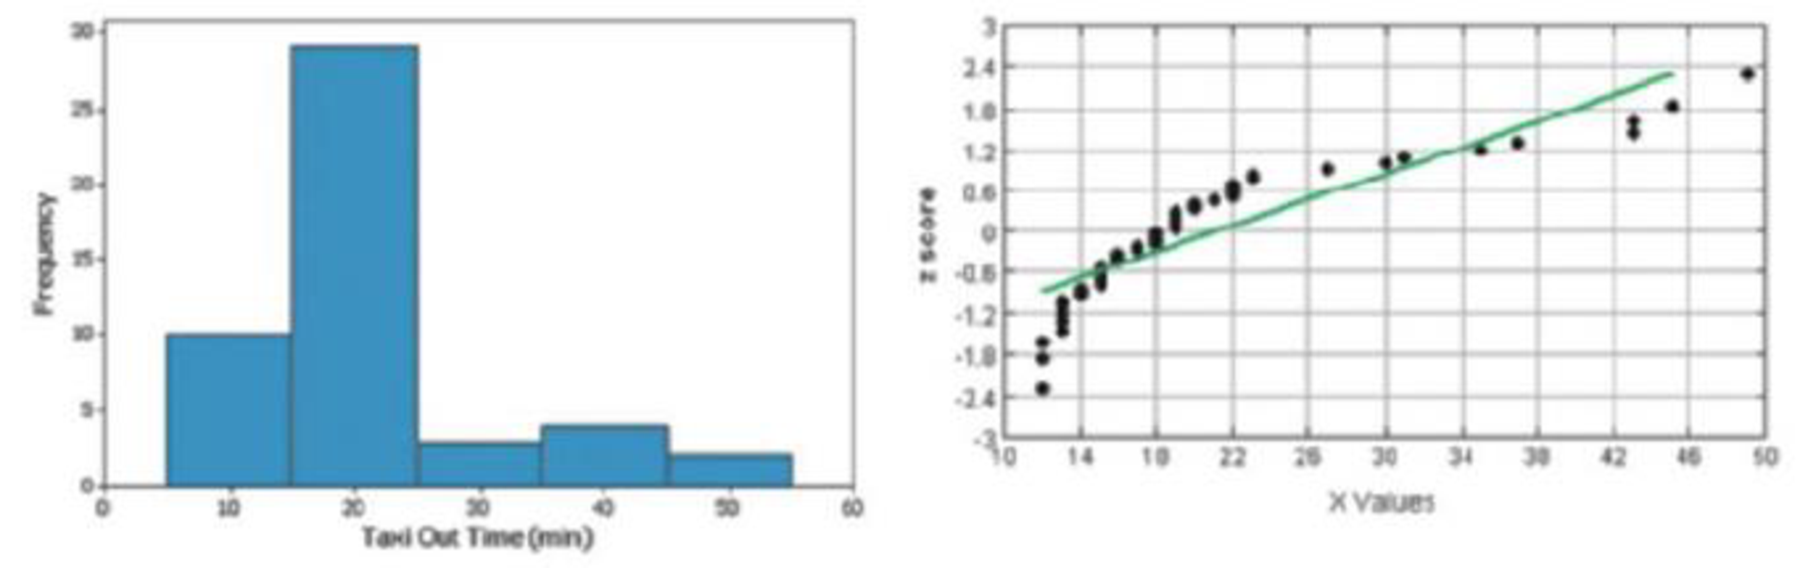
Normality Assessment A random sample consists of 48 times (min) required for American Airlines flights to taxi out for takeoff. All of the flights are American Airlines flights from New York (JFK) to Los Angeles and they all occurred in January of a recent year. The 48 taxi-out times are depicted in the histogram and normal quantile plot shown below. Based on those graphs, does it appear that the taxi-out times are from a population having a
Want to see the full answer?
Check out a sample textbook solution
Chapter 7 Solutions
Essentials of Statistics Plus MyLab Statistics with Pearson eText -- Access Card Package (6th Edition) (What's New in Statistics)


 Glencoe Algebra 1, Student Edition, 9780079039897...AlgebraISBN:9780079039897Author:CarterPublisher:McGraw Hill
 Big Ideas Math A Bridge To Success Algebra 1: Stu...AlgebraISBN:9781680331141Author:HOUGHTON MIFFLIN HARCOURTPublisher:Houghton Mifflin Harcourt
 Holt Mcdougal Larson Pre-algebra: Student Edition...AlgebraISBN:9780547587776Author:HOLT MCDOUGALPublisher:HOLT MCDOUGAL
 Calculus For The Life SciencesCalculusISBN:9780321964038Author:GREENWELL, Raymond N., RITCHEY, Nathan P., Lial, Margaret L.Publisher:Pearson Addison Wesley,