
Videos
Using Correct Distribution. In Exercises 5–8, assume that we want to construct a confidence interval. Do one of the following, as appropriate: (a) Find the critical value tα/2, (b) find the critical value zα/2 or (c) state that neither the
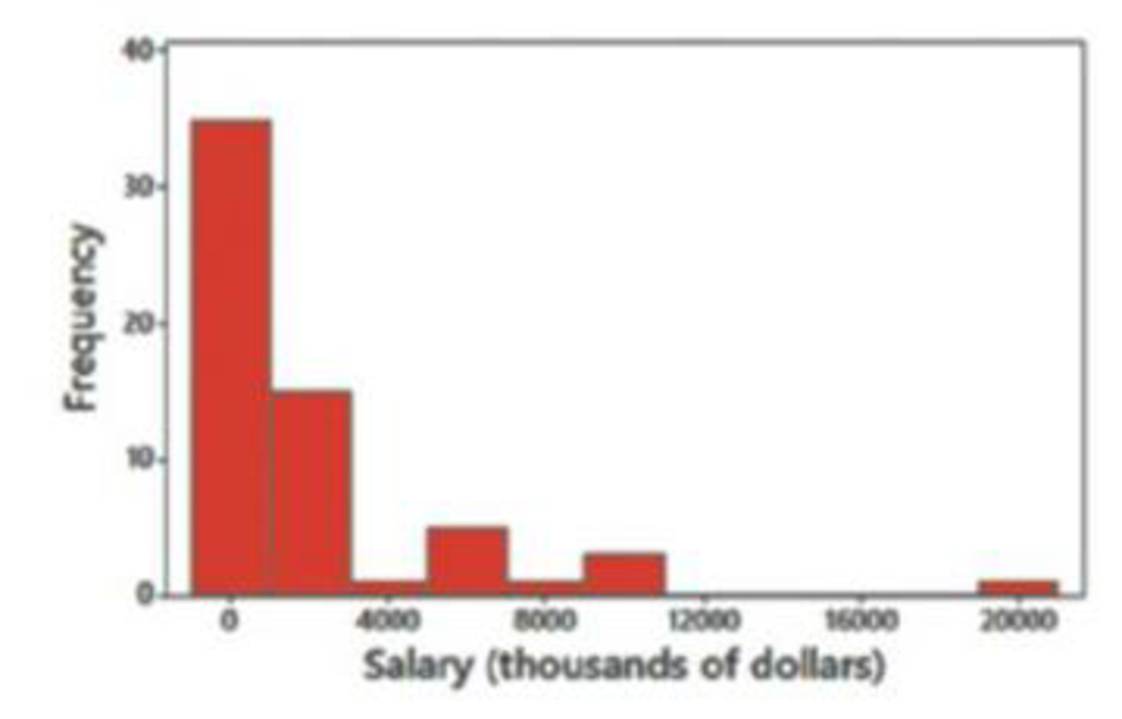
6. Denver Bronco Salaries Confidence level is 90%, σ is not known, and the histogram of 61 player salaries (thousands of dollars) is as shown.

Learn your wayIncludes step-by-step video

Chapter 7 Solutions
Essentials of Statistics Plus MyLab Statistics with Pearson eText -- Access Card Package (6th Edition) (What's New in Statistics)
Additional Math Textbook Solutions
Elementary Statistics
Basic Business Statistics, Student Value Edition
STATS:DATA+MODELS-W/DVD
Introductory Statistics (10th Edition)
Elementary Statistics: Picturing the World (6th Edition)


- Bighorn sheep are beautiful wild animals found throughout the western United States. Let x be the age of a bighorn sheep (in years), and let y be the mortality rate (percent that die) for this age group. For example, x = 1, y = 14 means that 14% of the bighorn sheep between 1 and 2 years old died. A random sample of Arizona bighorn sheep gave the following information: x 1 2 3 4 5 y 12.2 20.9 14.4 19.6 20.0 Σx = 15; Σy = 87.1 ; Σx2 = 55; Σy2 =1577.17; Σxy = 275.6 (a) Draw a scatter diagram. (b) Find the equation of the least-squares line. (Round your answers to two decimal places.) ŷ = + x (c) Find r. Find the coefficient of determination r2. (Round your answers to three decimal places.) r = r2 = Explain what these measures mean in the context of the problem. The correlation coefficient r measures the strength of the linear relationship between a bighorn sheep's age and the mortality rate. The coefficient of determination r2 measures the explained…arrow_forwardBighorn sheep are beautiful wild animals found throughout the western United States. Let x be the age of a bighorn sheep (in years), and let y be the mortality rate (percent that die) for this age group. For example, x = 1, y = 14 means that 14% of the bighorn sheep between 1 and 2 years old died. A random sample of Arizona bighorn sheep gave the following information: x 1 2 3 4 5 y 12.2 20.9 14.4 19.6 20.0 Σx = 15; Σy = 87.1 ; Σx2 = 55; Σy2 =1577.17; Σxy = 275.6 d) Test the claim that the population correlation coefficient is positive at the 1% level of significance. (Round your test statistic to three decimal places.) t = e) Find or estimate the P-value of the test statistic. P-value > 0.250 0.125 < P-value < 0.250 0.100 < P-value < 0.125 0.075 < P-value < 0.100 0.050 < P-value < 0.075 0.025 < P-value < 0.050 0.010 < P-value < 0.025 0.005 < P-value < 0.010 0.0005 < P-value < 0.005 P-value < 0.0005 Conclusion Reject the…arrow_forwardBighorn sheep are beautiful wild animals found throughout the western United States. Let x be the age of a bighorn sheep (in years), and let y be the mortality rate (percent that die) for this age group. For example, x = 1, y = 14 means that 14% of the bighorn sheep between 1 and 2 years old died. A random sample of Arizona bighorn sheep gave the following information: x 1 2 3 4 5 y 15.8 17.3 14.4 19.6 20.0 Σx = 15; Σy = 87.1; Σx2 = 55; Σy2 = 1,540.45; Σxy = 272 (a) Find x, y, b, and the equation of the least-squares line. (Round your answers for x and y to two decimal places. Round your least-squares estimates to three decimal places.) x = y = b = ŷ = + x (b) Draw a scatter diagram for the data. Plot the least-squares line on your scatter diagram. (c) Find the sample correlation coefficient r and the coefficient of determination r2. (Round your answers to three decimal places.) r = r2 = What percentage of variation in y is…arrow_forward
- Calculate the 95% confidence intervals for the proportion of children surviving, and the proportion of non-crew adult passengers surviving. We want to use the given data to make inferences about the general population of all large boat crashes, so the data set should be treated as a random sample for this purpose. The 95% confidence interval for survival rate amongst non-crew adults runs from? (Round to one decimal place as needed. Use ascending order.) Frequency table results for Adult/Child: Group: Survival=Alive Count = 711 Adult/Child Frequency Relative Frequency Adult 654 0.91983122 Child 57 0.080168776 Frequency table results for Adult/Child: Group: Survival=Dead Count = 1490 Adult/Child Frequency Relative Frequency Adult 1438 0.96510067 Child 52 0.034899329 Frequency table results for Class: Group: Survival=Alive Count = 711 Class Frequency Relative Frequency Crew 212 0.29817159 First 203 0.28551336 Second 118 0.16596343 Third 178…arrow_forwardExercise 1. Illustrate the value of the following t-distributions. a. two-tailed with a = 10% and df=10. b. one-tailed with a = 5% and df=18. c. two-tailed with a = 5% and n=29.arrow_forwardBighorn sheep are beautiful wild animals found throughout the western United States. Let x be the age of a bighorn sheep (in years), and let y be the mortality rate (percent that die) for this age group. For example, x = 1, y = 14 means that 14% of the bighorn sheep between 1 and 2 years old died. A random sample of Arizona bighorn sheep gave the following information: 1. 3 4 12.2 17.5 14.4 19.6 20.0 A USE SALT Ex = 15; Ey = 83.7; Ex² = 55; Ey? = 1,446.61; Exy = 268.8 (a) Find x, y, b, and the equation of the least-squares line. (Round your answers for x and y to two decimal places. Round your least-squares estimates to three decimal places.) y = (b) Draw a scatter diagram for the data. Plot the least-squares line on your scatter diagram. y y 22 22 20 20 18 18 16 16 14 14 12 12arrow_forward
- A non-profit organization is collecting data about how alcohol consumption affects academic performance. They want to perform a hypothesis test to see whether there is a relationship between how much alcohol a student consumes, and whether they are in good academic standing (GPA greater than or equal to 2.0). The results are summarized in the table below: Drinks 3+ Drinks per week Observed Data Good Academic Standing 137 Poor Academic Standing 40 Total 177 Expected Frequencies Good Academic Standing Poor Academic Standing Total a. Fill in the table of expected frequencies below. Round your answers to 2 decimal places. 177 Drinks 3+ Drinks per week 164 52 216 Ho: Alcohol consumption and academic standing are independent Ha: Alcohol consumption and academic standing are correlated Drinks 1-3 Drinks per week 216 d. Come to a conclusion: O Fail to reject the null hypothesis. O Reject the null hypothesis. Drinks 1-3 Drinks per week Ho: Not drinking any alcohol makes it more likely a student…arrow_forward3arrow_forwardBhuro.0p0arrow_forward
- X y 12 15 9 19 13 11 6 16 22 3 What is the upper bound of the 90% confidence interval for ?arrow_forwardFinal Conclusions. In Exercises 25–28, use a significance level of α = 0.05 and use the given information for the following: a. State a conclusion about the null hypothesis. (Reject H0 or fail to reject H0) b. Without using technical terms or symbols, state a final conclusion that addresses the original claim. Original claim: The standard deviation of pulse rates of adult males is more than 11 bpm. The hypothesis test results in a p-value of 0.3045.arrow_forwardDp4arrow_forward
 Glencoe Algebra 1, Student Edition, 9780079039897...AlgebraISBN:9780079039897Author:CarterPublisher:McGraw Hill