Concept explainers
Videos
1 a.
Calculate the gross profit for each year under periodic method using FIFO method.
1 a.
Explanation of Solution
Gross margin (gross profit): Gross margin is the amount of revenue earned from goods sold over the costs incurred for the goods sold.
FIFO: In First-in-First-Out method, items purchased initially are sold first. So, the value of the ending inventory consist the recent cost for the remaining unsold items.
Compute the gross profit for each year:
| Particulars | 2015 | 2016 | 2017 | 2018 |
| Sales | $400,000 | $550,000 | $750,000 | $600,000 |
| Less: Cost of goods sold (2) | ($160,000) | ($215,500) | ($286,500) | ($222,500) |
| Gross profit | $240,000 | $334,500 | $463,500 | $377,500 |
Table (1)
Thus, the gross profit for 2015, 2016, 2017, and 2018 are $240,000, $334,500, $463,500, and $377,500 respectively.
Working note 1: Determine the ending inventory:
| Computation of cost of ending inventory | ||||
| Particulars | 2015 | 2016 | 2017 | 2018 |
| Total production (A) | $200,000 | $234,000 | $247,000 | $240,500 |
| Units purchased (B) | 100,000 | 120,000 | 130,000 | 130,000 |
| Per unit cost | $2.00 | $1.95 | $1.90 | $1.85 |
| Units in ending inventory (D) | 20,000 | 30,000 | 10,000 | 20,000 |
| Cost of ending inventory | $40,000 | $58,500 | $19,000 | $37,000 |
Table (2)
Working note 2: Determine the cost of goods sold:
| Particulars | 2015 | 2016 | 2017 | 2018 |
| Beginning inventory | $0 | $40,000 | $58,500 | $19,000 |
| Add: Units purchased | $200,000 | $234,000 | $247,000 | $240,500 |
| Goods available for sale | $200,000 | $274,000 | $305,500 | $259,500 |
| Less: Ending inventory (1) | ($40,000) | ($58,500) | ($19,000) | ($37,000) |
| Cost of goods sold | $160,000 | $215,500 | $286,500 | $222,500 |
Table (3)
1 b.
Calculate the gross profit for each year under periodic method using LIFO method.
1 b.
Explanation of Solution
LIFO: In Last-in-First-Out method, items purchased recently are sold first. So, the value of the ending inventory consist the initial cost for the remaining unsold items.
Compute the gross profit for each year:
| Particulars | 2015 | 2016 | 2017 | 2018 |
| Sales | $400,000 | $550,000 | $750,000 | $600,000 |
| Cost of goods sold (6) | ($160,000) | ($214,500) | ($285,500) | ($222,000) |
| Gross profit | $240,000 | $335,500 | $464,500 | $378,000 |
Table (4)
Thus, the gross profit for 2015, 2016, 2017, and 2018 are $240,000, $335,500, $464,500, and $378,000 respectively.
Working note 3: Determine the ending inventory:
| Computation of cost of ending inventory | ||||
| Particulars | 2015 | 2016 | 2017 | 2018 |
| Total production | $200,000 | $234,000 | $247,000 | $240,500 |
| Units purchased | 100,000 | 120,000 | 130,000 | 130,000 |
| Per unit cost | $2.00 | $1.95 | $1.90 | $1.85 |
| Units in ending inventory | 20,000 | 30,000 | 10,000 | 20,000 |
| Cost of ending inventory | $40,000 | $59,500 | $20,000 | $38,500 |
Table (5)
Working note 4: Calculate ending inventory for the year 2016:
Working note 5: Calculate ending inventory for the year 2016:
Working note 6: Determine the cost of goods sold:
| Particulars | 2015 | 2016 | 2017 | 2018 |
| Beginning inventory | $0 | $40,000 | $58,500 | $20,000 |
| Add: Units purchased | $200,000 | $234,000 | $247,000 | $240,500 |
| Goods available for sale | $200,000 | $274,000 | $305,500 | $260,500 |
| Less: Ending inventory | ($40,000) | ($59,500) | ($20,000) | ($38,500) |
| Cost of goods sold | $160,000 | $214,500 | $285,500 | $222,000 |
Table (6)
1 c.
Calculate the gross profit for each year under periodic method using average cost method.
1 c.
Explanation of Solution
Average cost method: Under average cost method, company calculates a new average after every purchase. It is determined by dividing the cost of goods available for sale by the units on hand.
Compute the gross profit for each year:
| Particulars | 2015 | 2016 | 2017 | 2018 |
| Sales | $400,000 | $550,000 | $750,000 | $600,000 |
| Cost of goods sold (7) | ($160,000) | ($215,290) | ($286,600) | ($222,530) |
| Gross profit | $240,000 | $334,710 | $463,400 | $377,470 |
Table (7)
Thus, the gross profit for 2015, 2016, 2017, and 2018 are $240,000, $334,710, $463,400, and $377,470 respectively.
Working note 7: Determine the cost of goods sold:
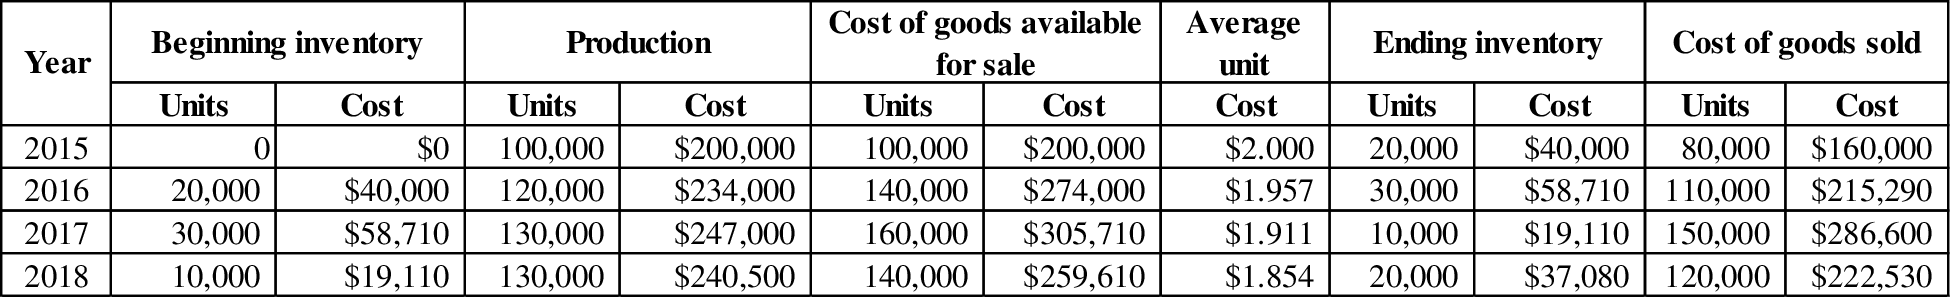
Table (8)
2.
Discuss the reasons whether the company’s return on assets would be higher under FIFO or LIFO.
2.
Explanation of Solution
In FIFO method, net income and total assets are higher than in LIFO (assuming rising costs). But, the net income is different by the annual difference between the two methods, while assets are different by the lifetime difference. Since, the LIFO denominator would be reduced by a larger amount than LIFO numerator, the ratio would be higher under LIFO method.
Want to see more full solutions like this?
Chapter 7 Solutions
Intermediate Accounting: Reporting and Analysis


- Habicht Company was formed in 2018 to produce a single product. The production and sales for the next 4 years were as follows: Required: 1. Determine the gross profit for each year under each of the following periodic inventory methods: a. FIFO b. LIFO c. Average cost (Round unit costs to 3 decimal places.) 2. Next Level Explain whether the companys return on assets (net income divided by average total assets) would be higher under FIFO or LIFO.arrow_forwardLIFO and Inventory Pools On January 1, 2016, Grover Company changed its inventory cost flow method to the LIFO cost method from the FIFO cost method for its raw materials inventory. It made the change for both financial statement and income tax reporting purposes. Grover uses the multiple-pools approach under which it groups substantially identical raw materials into LIFO inventory pools. It uses weighted average costs in valuing annual incremental layers. The composition of the December 31, 2018, inventory for the Class F inventory pool is as follows: Inventory transactions for the Class F inventory pool during 2019 were as follows: On March 2, 2019, 4,800 units were purchased at a unit cost of 13.50 for 64,800. On September 1, 2019, 7,200 units were purchased at a unit cost of 14.00 for 100,800. A total of 15,000 units were used for production during 2019. The following transactions for the Class F inventory pool took place during 2020: On January 11, 2020, 7,500 units were purchased at a unit cost of 14.50 for 108,750. On May 14, 2020, 5,500 units were purchased at a unit cost of 15.50 for 85,250. On December 29, 2020, 7,000 units were purchased at a unit cost of 16.00 for 112,000. A total of 16,000 units were used for production during 2020. Required: 1. Prepare a schedule to compute the inventory (units and dollar amounts) of the Class F inventory pool at December 31, 2019. Show supporting computations in good form. 2. Prepare a schedule to compute the cost of Class F raw materials used in production for the year ended December 31, 2019. 3. Prepare a schedule to compute the inventory (units and dollar amounts) of the Class F inventory pool at December 31, 2020. Show supporting computations in good form.arrow_forwardInventory Pools Stone Shoe Company adopted dollar-value LIFO on January 1, 2019. The company produces four products and uses a single inventory pool. The companys beginning inventory consists of the following: During 2019, the company has the following purchases and sales: Required: 1. Compute the dollar-value LIFO cost of the ending inventory. Round the cost index to 4 decimal places and all other amounts to the nearest dollar. 2. Next Level By how much would the companys gross profit differ if it had used four pools instead of a single pool?arrow_forward
- Olson Company adopted the dollar-value LIFO method for inventory valuation at the beginning of 2015. The following information about the inventory at the end of each year is available from Olsons records: Required: 1. Calculate the dollar-value LIFO inventory at the end of each year. 2. Prepare the appropriate disclosures for the 2021 annual report if Olson uses current cost internally and LIFO for financial reporting.arrow_forwardLower of Cost or Market Garcia Company uses FIFO, and its inventory at the end of the year was recorded in the accounting records at $17,800. Due to technological changes in the market, Garcia would be able to replace its inventory for $16,500. Required: 1. Using the lower of cost or market method, what amount should Garcia report for inventory on its balance sheet at the end of the year? 2. Prepare the journal entry required to value the inventory at the lower of cost or market.arrow_forwardAlternative Inventory Methods Park Companys perpetual inventory records indicate the following transactions in the month of June: Required: 1. Compute the cost of goods sold for June and the inventory at the end of June using each of the following cost flow assumptions: a. FIFO b. LIFO c. Average cost (Round unit costs to 3 decimal places and other amounts to the nearest dollar.) 2. Next Level Why are the cost of goods sold and ending inventory amounts different for each of the three methods? What do these amounts tell us about the purchase price of inventory during the year? 3. Next Level Which method produces the most realistic amount for net income? For inventory? Explain your answer. 4. Next Level If Park uses IFRS, which of the previous alternatives would be acceptable and why?arrow_forward
- A large manufacturer of truck and car tires recently changed its cost-flow assumption method for inventories at the beginning of 2014. The manufacturer has been in operation for almost 40 years, and for the last decade it has reported moderate growth in revenues. The firm changed from the LIFO method to the FIFO method and reported the following information (amounts in millions): REQUIRED Calculate the inventory turnover ratio for 2014 using the LIFO and FIFO cost-flow assumption methods. Explain why the costs assigned to inventory under LIFO at the end of 2013 and 2014 are so much less than they are under FIFO.arrow_forwardAnalyzing Inventory The recent financial statements of McLelland Clothing Inc. include the following data: Required: 1. Calculate McLellands gross profit ratio (rounded to two decimal places), inventory turnover ratio (rounded to three decimal places), and the average days to sell inventory (assume a 365-day year and round to two decimal places) using the FIFO inventory costing method. Be sure to explain what each ratio means. 2. Calculate McLellands gross profit ratio (rounded to two decimal places), inventory turnover ratio (rounded to three decimal places), and the average days to sell inventory (assume a 365-day year and round to two decimal places) using the LIFO inventory costing method. Be sure to explain what each ratio means. 3. CONCEPTUAL CONNECTION Which ratios-the ones computed using FIFO or LIFO inventory values-provide the better indicator of how successful McLelland was at managing and controlling its inventory?arrow_forwardInventory Costing Methods Crandall Distributors uses a perpetual inventory system and has the following data available for inventory, purchases, and sales for a recent year. Required: 1. Compute the cost of ending inventory and the cost of goods sold using the specific identification method. Assume the ending inventory is made up of 40 units from beginning inventory, 30 units from Purchase 1, 80 units from Purchase 2, and 40 units from Purchase 3. 2. Compute the cost of ending inventory and cost of goods sold using the FIFO inventory costing method. 3. Compute the cost of ending inventory and cost of goods sold using the LIFO inventory costing method. 4. Compute the cost of ending inventory and cost of goods sold using the average cost inventory costing method. ( Note: Use four decimal places for per-unit calculations and round all other numbers to the nearest dollar.) 5. CONCEPTUAL CONNECTION Compare the ending inventory and cost of goods sold computed under all four methods. What can you conclude about the effects of the inventory costing methods on the balance sheet and the income statement?arrow_forward
- Inventory Write-Down Stiles Corporation uses the FIFO cost flow assumption and is in the process of applying the LCNRV rule for each of two products in its ending inventory. A profit margin of 30% on the selling price is considered normal for each product. Specific data for each product are as follows: Inventory Write-Down Use the information in E8-1. Assume that Stiles uses the LIFO cost flow assumption and is applying the LCM rule. Required: 1. What is the correct inventory value for each product? 2. Next Level With regard to requirement 1, what effect does the imposition of the constraints on market value have on the inventory valuations?arrow_forwardInventory Analysis The following account balances are taken from the records of Lewis Inc., a wholesaler of fresh fruits and vegetables: Required Compute Lewiss inventory turnover ratio for 2016 and 2015. Compute the number of days sales in inventory for 2016 and 2015. Assume 360 days in a year. Comment on your answers in parts (1) and (2) relative to the companys management of inventory over the two years. What problems do you see in its inventory management?arrow_forwardEffects of an Inventory Error The income statements for Graul Corporation for the 3 years ending in 2019 appear below. During 2019, Graul discovered that the 2017 ending inventory had been misstated due to the following two transactions being recorded incorrectly. a. A purchase return of inventory costing $42,000 was recorded twice. b. A credit purchase of inventory' made on December 20 for $28,500 was not recorded. The goods were shipped F.O.B. shipping point and were shipped on December 22, 2017. Required: 1. Was ending inventory for 2017 overstated or understated? By how much? 2. Prepare correct income statements for all 3 years. 3. CONCEPTUAL CONNECTION Did the error in 2017 affect cumulative net income for the 3-year period? Explain your response. 4. CONCEPTUAL CONNECTION Why was the 2019 net income unaffected?arrow_forward
 Intermediate Accounting: Reporting And AnalysisAccountingISBN:9781337788281Author:James M. Wahlen, Jefferson P. Jones, Donald PagachPublisher:Cengage Learning
 Financial Accounting: The Impact on Decision Make...AccountingISBN:9781305654174Author:Gary A. Porter, Curtis L. NortonPublisher:Cengage Learning
 Cornerstones of Financial AccountingAccountingISBN:9781337690881Author:Jay Rich, Jeff JonesPublisher:Cengage Learning
 Financial Reporting, Financial Statement Analysis...FinanceISBN:9781285190907Author:James M. Wahlen, Stephen P. Baginski, Mark BradshawPublisher:Cengage LearningPrinciples of Accounting Volume 1AccountingISBN:9781947172685Author:OpenStaxPublisher:OpenStax College