
Essentials of Business Analytics (MindTap Course List)
2nd Edition
ISBN: 9781305627734
Author: Jeffrey D. Camm, James J. Cochran, Michael J. Fry, Jeffrey W. Ohlmann, David R. Anderson
Publisher: Cengage Learning
expand_more
expand_more
format_list_bulleted
Concept explainers
Videos
Textbook Question
Chapter 7, Problem 9P
Dixie Showtime Movie Theaters, Inc., owns and operates a chain of cinemas in several markets in the southern United States. The owners would like to estimate weekly gross revenue as a
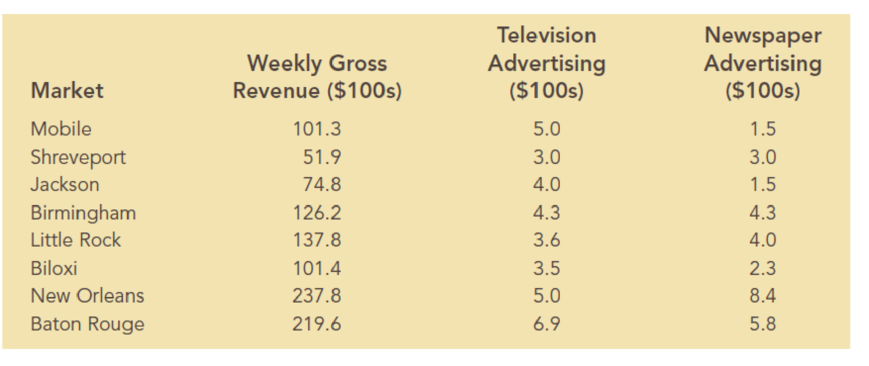
- a. Develop an estimated regression equation with the amount of television advertising as the independent variable. Test for a significant relationship between television advertising and weekly gross revenue at the 0.05 level of significance. What is the interpretation of this relationship?
- b. How much of the variation in the sample values of weekly gross revenue does the model in part (a) explain?
- c. Develop an estimated regression equation with both television advertising and newspaper advertising as the independent variables. Test whether each of the regression parameters β0, β1, and β2 is equal to zero at a 0.05 level of significance. What are the correct interpretations of the estimated regression parameters? Are these interpretations reasonable?
- d. How much of the variation in the sample values of weekly gross revenue does the model in part (c) explain?
- e. Given the results in parts (a) and (c), what should your next step be? Explain.
- f. What are the managerial implications of these results?
Expert Solution & Answer

Trending nowThis is a popular solution!

Chapter 7 Solutions
Essentials of Business Analytics (MindTap Course List)
Ch. 7 - Bicycling World, a magazine devoted to cycling,...Ch. 7 - In a manufacturing process the assembly line speed...Ch. 7 - Jensen Tire Auto is deciding whether to purchase...Ch. 7 - A sociologist was hired by a large city hospital...Ch. 7 - The regional transit authority for a major...Ch. 7 - A marketing professor at Givens College is...Ch. 7 - The Dow Jones Industrial Average (DJIA) and the...Ch. 7 - The Toyota Camry is one of the best-selling cars...Ch. 7 - Dixie Showtime Movie Theaters, Inc., owns and...Ch. 7 - Prob. 10P
Ch. 7 - The American Association of Individual Investors...Ch. 7 - The National Football League (NFL) records a...Ch. 7 - Johnson Filtration. Inc., provides maintenance...Ch. 7 - A study investigated the relationship between...Ch. 7 - The U.S. Department of Energys Fuel Economy Guide...Ch. 7 - A highway department is studying the relationship...Ch. 7 - A sample containing years to maturity and...Ch. 7 - In 2011, home prices and mortgage rates fell so...Ch. 7 - A recent 10-year study conducted by a research...Ch. 7 - The Scholastic Aptitude Test (or SAT) is a...Ch. 7 - Consider again the example introduced in Section...Ch. 7 - Alumni donations are an important source of...
Knowledge Booster


Learn more about
Need a deep-dive on the concept behind this application? Look no further. Learn more about this topic, statistics and related others by exploring similar questions and additional content below.Similar questions
- Find the equation of the regression line for the following data set. x 1 2 3 y 0 3 4arrow_forwardFor the following exercises, use Table 4 which shows the percent of unemployed persons 25 years or older who are college graduates in a particular city, by year. Based on the set of data given in Table 5, calculate the regression line using a calculator or other technology tool, and determine the correlation coefficient. Round to three decimal places of accuracyarrow_forwardFor the following exercises, consider the data in Table 5, which shows the percent of unemployed in a city ofpeople25 years or older who are college graduates is given below, by year. 41. Based on the set of data given in Table 7, calculatethe regression line using a calculator or othertechnology tool, and determine the correlationcoefficient to three decimal places.arrow_forward
arrow_back_ios
arrow_forward_ios
Recommended textbooks for you
 Functions and Change: A Modeling Approach to Coll...AlgebraISBN:9781337111348Author:Bruce Crauder, Benny Evans, Alan NoellPublisher:Cengage Learning
 Algebra and Trigonometry (MindTap Course List)AlgebraISBN:9781305071742Author:James Stewart, Lothar Redlin, Saleem WatsonPublisher:Cengage Learning
 Glencoe Algebra 1, Student Edition, 9780079039897...AlgebraISBN:9780079039897Author:CarterPublisher:McGraw Hill
 Big Ideas Math A Bridge To Success Algebra 1: Stu...AlgebraISBN:9781680331141Author:HOUGHTON MIFFLIN HARCOURTPublisher:Houghton Mifflin Harcourt
Functions and Change: A Modeling Approach to Coll...
Algebra
ISBN:9781337111348
Author:Bruce Crauder, Benny Evans, Alan Noell
Publisher:Cengage Learning
Algebra and Trigonometry (MindTap Course List)
Algebra
ISBN:9781305071742
Author:James Stewart, Lothar Redlin, Saleem Watson
Publisher:Cengage Learning
Glencoe Algebra 1, Student Edition, 9780079039897...
Algebra
ISBN:9780079039897
Author:Carter
Publisher:McGraw Hill
Big Ideas Math A Bridge To Success Algebra 1: Stu...
Algebra
ISBN:9781680331141
Author:HOUGHTON MIFFLIN HARCOURT
Publisher:Houghton Mifflin Harcourt
Correlation Vs Regression: Difference Between them with definition & Comparison Chart; Author: Key Differences;https://www.youtube.com/watch?v=Ou2QGSJVd0U;License: Standard YouTube License, CC-BY
Correlation and Regression: Concepts with Illustrative examples; Author: LEARN & APPLY : Lean and Six Sigma;https://www.youtube.com/watch?v=xTpHD5WLuoA;License: Standard YouTube License, CC-BY